
Lowering risk through active high-yield strategies

Is it possible to conquer the “low risk/good returns” challenge with active strategies? High-yield bonds may offer an attractive risk-managed opportunity.
The answer I received most often was, not surprisingly, “good returns with low risk.” Over the years, this sentiment has remained a constant, the “North Star” of investor objectives. I have used it to guide my own investment strategies and to evaluate the philosophies and performance of other investment managers.
Looking at the performance of my peer money managers, I concluded early on that many large managers generally did very little to moderate risk. Because I was looking for “good returns with low risk,” any managers who had losses similar to the overall market, as represented by the S&P 500, were ruled out.
One of the most accepted ideas in investment thinking is that “the returns of buy and hold are very good over time, and that all sell-offs eventually lead to recoveries.” I don’t believe that reflects any type of risk management, and most investors cannot really tolerate that passive strategy.
Individual investors tend to buy and sell at the wrong times (despite advice to the contrary), which obviously leads to significantly lower returns over the years. Who has not heard buy-and-hold investors say that they “can’t take the pain” during a severe bear market? They are invariably slow to shield their portfolios from losses, sell out at crescendo bottoms, and then fail to return early enough to take advantage of the next bull market. While not ideal, there is a certain truth to the statement, “Panic early or not at all.”
I believe active management can offer more viable solutions to the “low risk/good return” challenge. Active management can make investments easier to live with and, therefore, easier to stay with. I am always looking not for the highest return, but the best strategy that can fit my clients and their long-term needs.
The search for a better way
With a Ph.D. in psychology, I came into the investment industry with relatively sophisticated knowledge of advanced statistics and experimental design. I have used this background to develop my trading strategies and models. My methodology has always been relatively simple—I explore historical data to determine what trading signals I could use that would maximize returns and limit losses.
Obviously, much of my research relies on vast amounts of data and computers. I am always looking for the best reward-risk ratio (I call it the information ratio) over the longest period of time. The information ratio is just annualized returns divided by annualized volatility, and it gives one a meaningful measure of reward to risk. Values over 1.0 are very good; it says that you are getting more reward for each unit of risk. For example, the S&P has a 20-year ratio (using daily prices) of about 0.30, meaning that you take three times the risk for every one unit of reward. When you have a ratio of 1.5, you are taking only two-thirds of the risk for every one unit of profit, a much better trade-off.
If a strategy did not or would not have performed well in 2008–2009 or 2000–2002, I am not interested in pursuing it. Large drawdowns are too difficult for investors and investment advisors, both mathematically and psychologically. In addition, I will not use strategies where I cannot see daily, or at least monthly, returns. Yearly, 5-year, and 10-year numbers can be very deceptive.
I would not suggest my approach is foolproof or without issues. I will say that over the years, this methodology has allowed me to develop trading models that have been extremely successful in fulfilling my goals, and those of my clients.
Choosing an asset class: why high-yield investing is attractive
I believe that high-yield investing is one of the most misunderstood of investment classes. During the past 10 years, high-yield funds have shown remarkably low risk compared to the S&P (about one-fifth), while posting good returns (about one-half to two-thirds of the S&P). These numbers will vary depending on the period studied, but they are still promising overall. Unfortunately, investors tend to look at returns more than risk.
High-yield municipal bonds and other types of high-yield bonds have a feature that makes them a great choice for trend-following: low noise. We can measure volatility in different ways. In Table 1, the annualized volatility is the standard deviation of returns, the typical measurement of risk. You can see that the volatility of daily returns is far lower for the high-yield funds than for the S&P 500. The maximum drawdown, which occurred in 2008, is large for all funds, but still much greater for the S&P 500. The key to using high-yield funds can be seen on the last line, the average noise.
TABLE 1: AVERAGE NOISE
S&P vs. high-yield munis (HYMAX) and high-yield bonds (AMHYX)
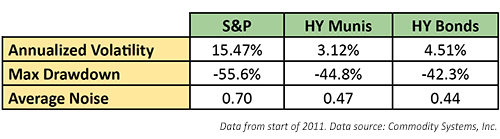
Noise is not volatility. Think of it as a drunken sailor’s walk. On the way to the pub, the sailor walks in a straight line. The noise of his path is zero. On the way back, he stumbles in all directions, so his path is much longer; therefore, there is more noise. The calculation for noise is the absolute value of the price change over N days (the straight-line distance) divided by the sum of the absolute values of each daily price change over the same N days (the actual path of the sailor, including forward and backward steps). We subtract that value from 1 so that a value of zero means no noise and a value of 1 is all noise.
When there is high noise, the market is going nowhere; it is mean-reverting. When there is low noise the market is trending. The value of 0.44 or 0.47 for the funds compared to 0.70 for the S&P 500 indicates that the funds are nearly twice as trending as the S&P. That makes them excellent candidates for applying a trending strategy. That strategy can make up for the shortfall in the underlying returns while keeping the risk low.
Contrary to most thinking, high-yield funds are not vulnerable to interest-rate changes. Consider the following:
- The default ratio for high-yield bonds has been very low for years.
- The daily volatility of these funds is much lower than equity funds.
- High-yield funds have performed relatively well in times of rising rates. The real risk to high-yield bonds is not rising rates but a dramatically weakening economy. For example, when oil prices fell over the past few years, and there was the risk of bankruptcies in the oil arena, high-yield bonds did weaken.
- High-yield funds do not behave like Treasury-bond funds, which have an inverse relationship to bond prices.
The model I have been using since 2011 invests long-only in regular high-yield and municipal high-yield funds. Part of the reason I decided to use this model was the macro investment picture at the time. Bill Gross (then of PIMCO) was one of the most notable analysts suggesting a semi-permanent change in the global investment environment. Gross repeatedly stated (and supported) that we were entering a “new normal,” which suggests that low rates and slow growth should be the outlook for the foreseeable future.
In a low-growth environment, high yield looked enticing, but I would not invest in any asset class without a means of monitoring risk. To uncover the risk, I followed my disciplined procedure of analyzing historical price movements. (Let me note that, in addition to the current environment, my research shows this strategy has been effective for the last 20 years, or since high-yield funds started gaining traction in the market.)
Focusing on risk
I believe that investors are willing to accept somewhat lower returns in exchange for much lower risk. For many, the devastating losses of past bear markets are still too close to forget.
With this philosophy in mind, I settled on a model that is strictly technical in nature and does not utilize fundamental analysis. The nature of the model is trend following. A trend can be identified using a simple moving average. What is most important is the time interval over which you define the trend, not the technique. You can decide if the trend is up when the price moves above the trend line (the average) or when the trend line itself is moving higher. By its nature, a trend-following program is a conservation-of-capital strategy: it cuts losses short and lets profits run.
The model invests in a combination of regular high-yield mutual funds and municipal high-yield mutual funds when they are trending up, and money-market funds when the trend turns down. While invested, we strive to achieve both high-dividend yields and capital appreciation. We stay in the money market to preserve capital when there is market turmoil or the trend is negative. The use of these three funds gives a broader range of investment choices, as well as increasing diversification.
As you can see in Table 2, the correlation between the high-yield bonds and the high-yield municipal bonds is only about 0.282, so they have surprisingly little relationship to each other. In 2014, for example, high-yield bonds were flat to down, whereas high-yield municipal bonds were having a great year. In 2016, both have had good returns, but regular high-yield bonds are much stronger. It is infrequent (only 14% of the time) that both move up simultaneously with my signals. Having two asset classes with a low correlation provides additional opportunities to make money.
TABLE 2: CORRELATION BETWEEN FUNDS (2011–JULY 2016)
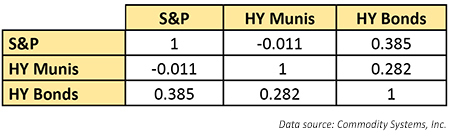
S&P (RYDEX RYSPX), HY munis (HYMAX, Lord Abbett High Yield Municipal Bond A), and HY bonds (AMHYX, Invesco High Yield Bonds A)
To me, the low correlation of both high-yield funds to the S&P is an added benefit. This model makes money not because it follows the S&P.
Evaluating performance
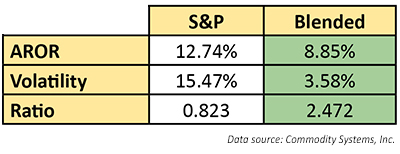
Since 2011, the model that I chose has realized an annualized return of 8.85% net of management fees, as monitored by the research firm Theta Investments.
In addition, the maximum drawdown based on monthly data was only -1.47% for this entire time.
TABLE 3: S&P (RYSPX) VS. A BLENDED HIGH-YIELD FUND, 2011–JULY 2016:
Comparison of returns, risk (volatility), and information ratio
As monitored by Theta Investments, the blended high-yield bond program has also shown excellent performance across several time periods, based on the Ulcer Index. The Ulcer Index is designed as a measure of volatility, but only volatility in the downward direction (analysts call that semi-variance), that is, the drawdowns, or retracements, occurring over the entire period. To me, having a low Ulcer Index, combined with an 8.85% annualized return, makes this a very appealing investment approach.
Why is the Ulcer Index so important? I believe investors have the most trouble staying with an investment program when they are losing money. For many, the pain of losing becomes so strong, they just want to sell everything to stop the pain. At that point their decision becomes emotional, not logical. Stated another way, an investment approach with a relatively low Ulcer Index is easier for clients to live with and stay the course, especially in volatile market environments.
Why do many people think of investing as high-risk gambling?
The reality is that, given enough time, equity markets are very volatile. This leads to large drawdowns, as seen in Table 4.
TABLE 4: MAXIMUM DRAWDOWN OF THE ETF SPY
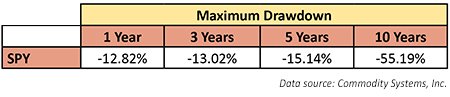
Losing 55% of an account value certainly seems like gambling. It points out the uncertainty of yearly returns. Using a strategy that limits downside volatility by using active management is an attempt to take away some of the uncertainty people experience with their investments. I have found that clients who lose very little and see their accounts gradually increasing are ultimately those with the highest levels of satisfaction with their advisor.
Disclosure: Securities offered through Royal Alliance Associates. Member FINRA/SIPC. Advisory services offered through New Century Financial Group, LLC, an SEC registered investment advisor.
 Herb Friedman, Ph.D., is a registered representative with Royal Alliance Associates Inc. and a financial advisor with New Century Financial Group LLC. After a career as a psychotherapist, Mr. Friedman consulted for several years with Fortune 500 financial companies. He has been an investment advisor for over two decades and specializes in the strategy of active management. www.ncfg.com