

Editor’s note: With all of the uncertainty and unprecedented nature of this year’s election season, are there certain long-term historical trends related to political outcomes that investors should consider? This week’s “Topping the Charts” features information from Flexible Plan Investments (FPI) on their proprietary “Political Seasonality Index” (PSI) and some specific findings related to “party-in-power” trends. Their nonpartisan analysis of the historical relationships between politics and market trends can be found here, and will be updated weekly through November 8, 2016.
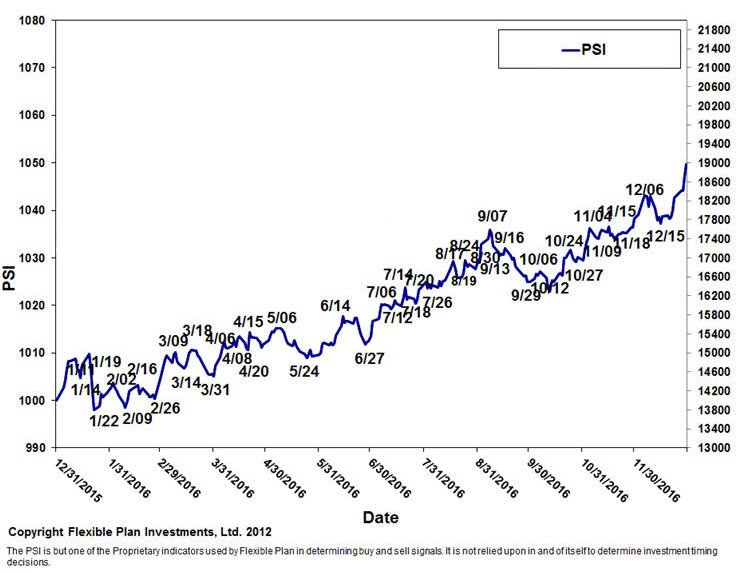
Flexible Plan Investments’ Political Seasonality Index (PSI) was first made available to Barron’s readers in the 1990s. Calculating 11 different political and seasonal factors, the Political Seasonality Index’s goal is to offer the investor a forewarning of the market’s topography a year in advance using dots on the stock market’s seasonal tendencies.
FPI’s proprietary database of relevant political factors (such as the controlling party in the House, Senate, and White House) and seasonal factors (such as day of the week, month of the year, and proximity to holidays) dates back to 1885. Daily changes in the Dow Jones Industrial Index, also dating to 1885, are used in conjunction with the political and seasonal factors to generate the PSI. The highest daily low points of the PSI form the basis for the buy and sell signals of the PSI strategy for the coming year. Trades are made in a Dow Jones–based index fund or a fund closely resembling the Dow Jones 30 Index.
Figure 1 provides an overview of the multifactor PSI “forecast” for 2016, based on historical trend data.
FIGURE 1: 2016 POLITICAL SEASONALITY INDEX
Does the party affiliation of the president actually impact market trends?
During just about every election cycle, you will see a multitude of articles featuring that old chestnut that stocks do better under Democratic presidents. Regardless of why that is (timing of national crises, being a beneficiary of previous administration’s policies, freer spending, or more liberal monetary policies, etc.), no matter how you slice the data, the results do support that conclusion.
For example, since 1900, the stock market—as measured by the only stock index that goes back that far, the Dow Jones Industrial Average—has advanced (price change only, no dividends) 3.51% (compound annual growth rate) during Democratic presidential administrations (13,700 days), while only achieving a 1.43% return during Republican presidencies (15,436 days).
If we focus instead on the shorter period of 1972 to the present (data for many asset classes does not go back any further back than that), the disparity remains at 4.6 % to 2.43%.
These types of comparison in the stock market arena are readily available in the popular press. However, it is difficult to find comparisons of how other assets perform during the two types of presidential administrations.
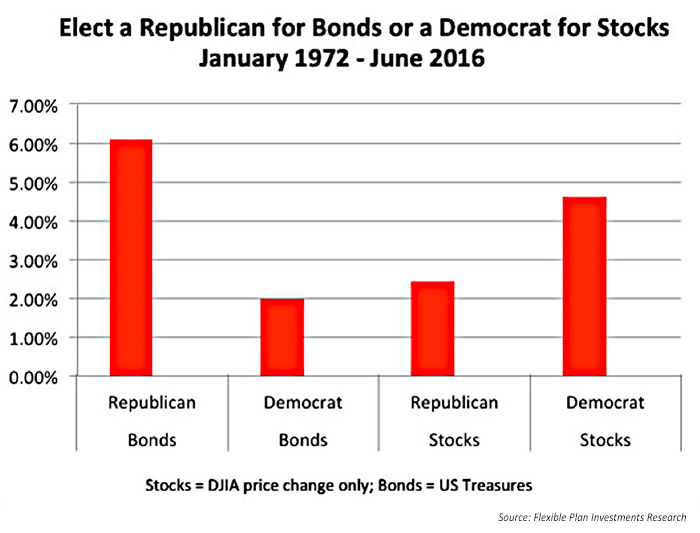
Far larger than the stock market is our bond market. The largest portion of that market is the U.S. Treasury bond market. In contrast to the results in the stock market, Republican administrations have been much better for bond investors. Since 1972, returns for the Treasury bond market during Republican administrations have averaged 6.1 % annually versus 1.98% during Democratic administrations.
FIGURE 2: STOCKS VS. BONDS DURING REPUBLICAN AND DEMOCRATIC ADMINISTRATIONS
As one would expect with such findings, interest rates tend to be higher under Republican administrations. During that same period, the yield of 10-year government bonds has averaged 2.37% during the Democrats’ time in office versus 4.31% with the Republicans.
Other asset classes followed in the financial market tend to break both ways, as can be seen in Figure 3.
FIGURE 3: PARTY OF THE PRESIDENT (1972–6/30/2016)
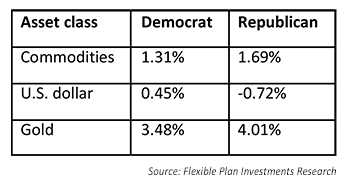
Depending on the election results, an investor’s portfolio should look very different if the relationships outlined here hold in the next four years. A win by the Democrat might lead to consideration of a portfolio of predominantly international stocks diversified with gold, while a Republican presidential victory would suggest a more bond-oriented portfolio with domestic stocks and gold.