

The total-return graph (Figure 1) illustrates longer-term price trends for four important bond market sectors (there are several others): U.S. government bonds, high-yield bonds, municipal bonds, and international bonds. When displayed together they provoke a number of observations.
First, U.S. government bonds have performed the best in recent years. They also represent one of the most volatile of the four bond market sectors illustrated. As the relative strength of government bonds in 2008–9 shows, they can act as a safe haven for investors. Other bond market sectors declined in those years, with investors fearing credit quality downgrades and increased default risk. U.S. government bonds went up, since they theoretically have no credit risk.
FIGURE 1: COMPARISON OF LONGER-TERM PRICE TRENDS FOR FOUR CATEGORIES OF BONDS
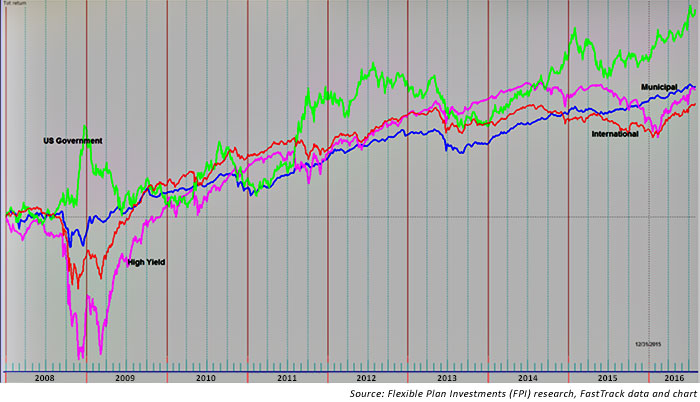
Another observation is that high-yield bonds track equity patterns as much or more than they track interest-rate patterns. There are a number of reasons for this. One of the more important is that the price of high-yield bonds is closely tied to the financial health of the issuing company. So, the better the company and company’s stock does, the higher the valuation of the company’s bonds. Of course, the converse is also true. In 2008, when equities and the economy were declining, high-yield bonds declined sharply along with equities. Then, in 2009, when financial market fears began to lessen, stocks rose, and the high-yield bond sector rose with it. High-yield bonds are, therefore, often used as an indicator for the stock market. If both are trending in the same direction, it is considered confirmation of the trend. When they are going in opposite directions, it is considered a non-confirmation of the trend.
The two remaining bond market sectors present a bit more complexity in understanding the influences on their respective price behavior. Municipal bonds have limited liquidity, similar to that of high-yield bonds. One benefit of this for investors is that the lack of liquidity often leads to relatively smooth trends, unlike U.S. government bonds. Municipal bonds are influenced by factors other than just credit rating. Two of the most important factors are interest-rate trends and the federal tax code. Tax code changes, which can include the way municipal-bond interest is taxed, can influence the way investors price municipal bonds.
Figure 1 illustrates international bonds denominated in U.S. dollars. This presents an additional factor that comes into play with international bonds. While all bond market sectors have benefited from the long-term decline in interest rates, international bonds have a currency translation issue to take into consideration. For example, international bonds have generally gone sideways since 2014, when the U.S. dollar began to strengthen. The reverse also happens. When the U.S. dollar weakens, it takes more dollars to buy a foreign asset, so the price in dollars for international bonds generally goes up.
Each of these bond market sectors have unique characteristics that investors seek for a purpose. Understanding that all sectors within an asset class are not created equal can help in designing allocations to achieve attractive returns in risk portfolios.
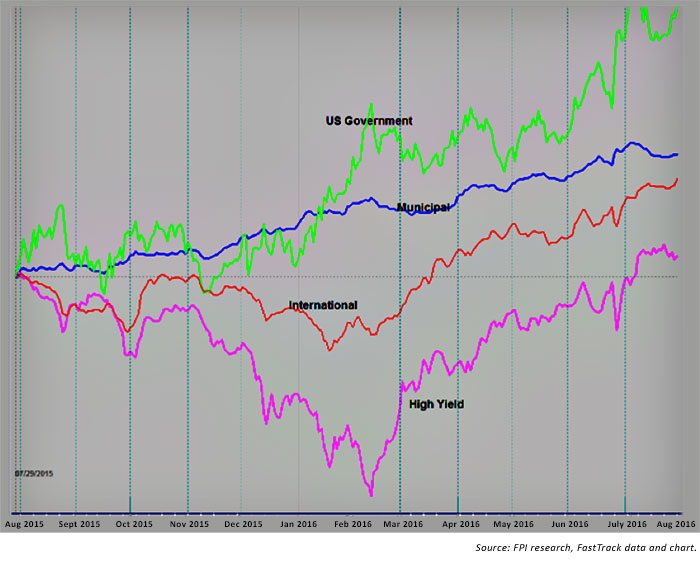
The following figure and table illustrate the returns of the four bond market sectors for 2016 YTD, highlighting how they can perform very differently.
FIGURE 2: ONE-YEAR BOND SECTOR PRICE TRENDS (AUGUST 2015–AUGUST 2016)
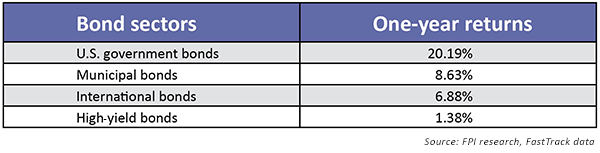
ONE-YEAR BOND SECTOR RETURNS, AUGUST 2015–AUGUST 2016
 Peter Mauthe is vice president of corporate development at Flexible Plan Investments, Ltd., where he develops new business initiatives and implements corporate and business-level strategies. Mr. Mauthe has been an independent market maker on the Chicago Board Options Exchange; served as president of the American Association of Professional Technical Analysts; and was president, chairman, and director of the National Association of Active Investment Managers (NAAIM). flexibleplan.com