


One of the advantages of incorporating charts into long-term investing analysis is the ability to visualize what has been going on with the stock, index, or ETF over time. Another advantage of using charts and technical analysis when researching long-term portfolio investing is to provide a faster method for finding and selecting stocks.
Using industry and sector index charts is one way of helping to identify where the next generation of growth stocks are likely to be found. The use of the Industry Index chart also helps with decisions regarding mutual funds and other stock investment derivatives such as ETFs. Many investors find that studying industries first by using the index chart can eliminate many of the difficulties in focusing on where to invest.
We use three Super Sector index charts (provided by TC2000, based primarily on Morningstar classifications): Cyclical, Sensitive, and Defensive. There are 11 sectors: Basic Materials, Industrials, Technology, Consumer Cyclical, Financial Services, Real Estate, Consumer Defensive, Health Care, Utilities, Communication Services, and Energy. Each sector is broken down further into specific industries. Some industries have less than 10 companies, while others have hundreds. Choosing an industry that has many companies is often a good place to start.
There are 146 industries within the 11 sectors. One example is Biotechnology, which falls under the Health Care sector and has 486 companies as component stocks. These are listed stocks on the U.S. exchanges. Biotechnology has strong potential for future growth, with newly emerging technologies in many areas of science, the environment, and medicine.
The Biotechnology Index chart provides a wealth of information on how this industry has been performing, and where it is in the industry business cycle. This is a line chart on a monthly scale (Figure 1).
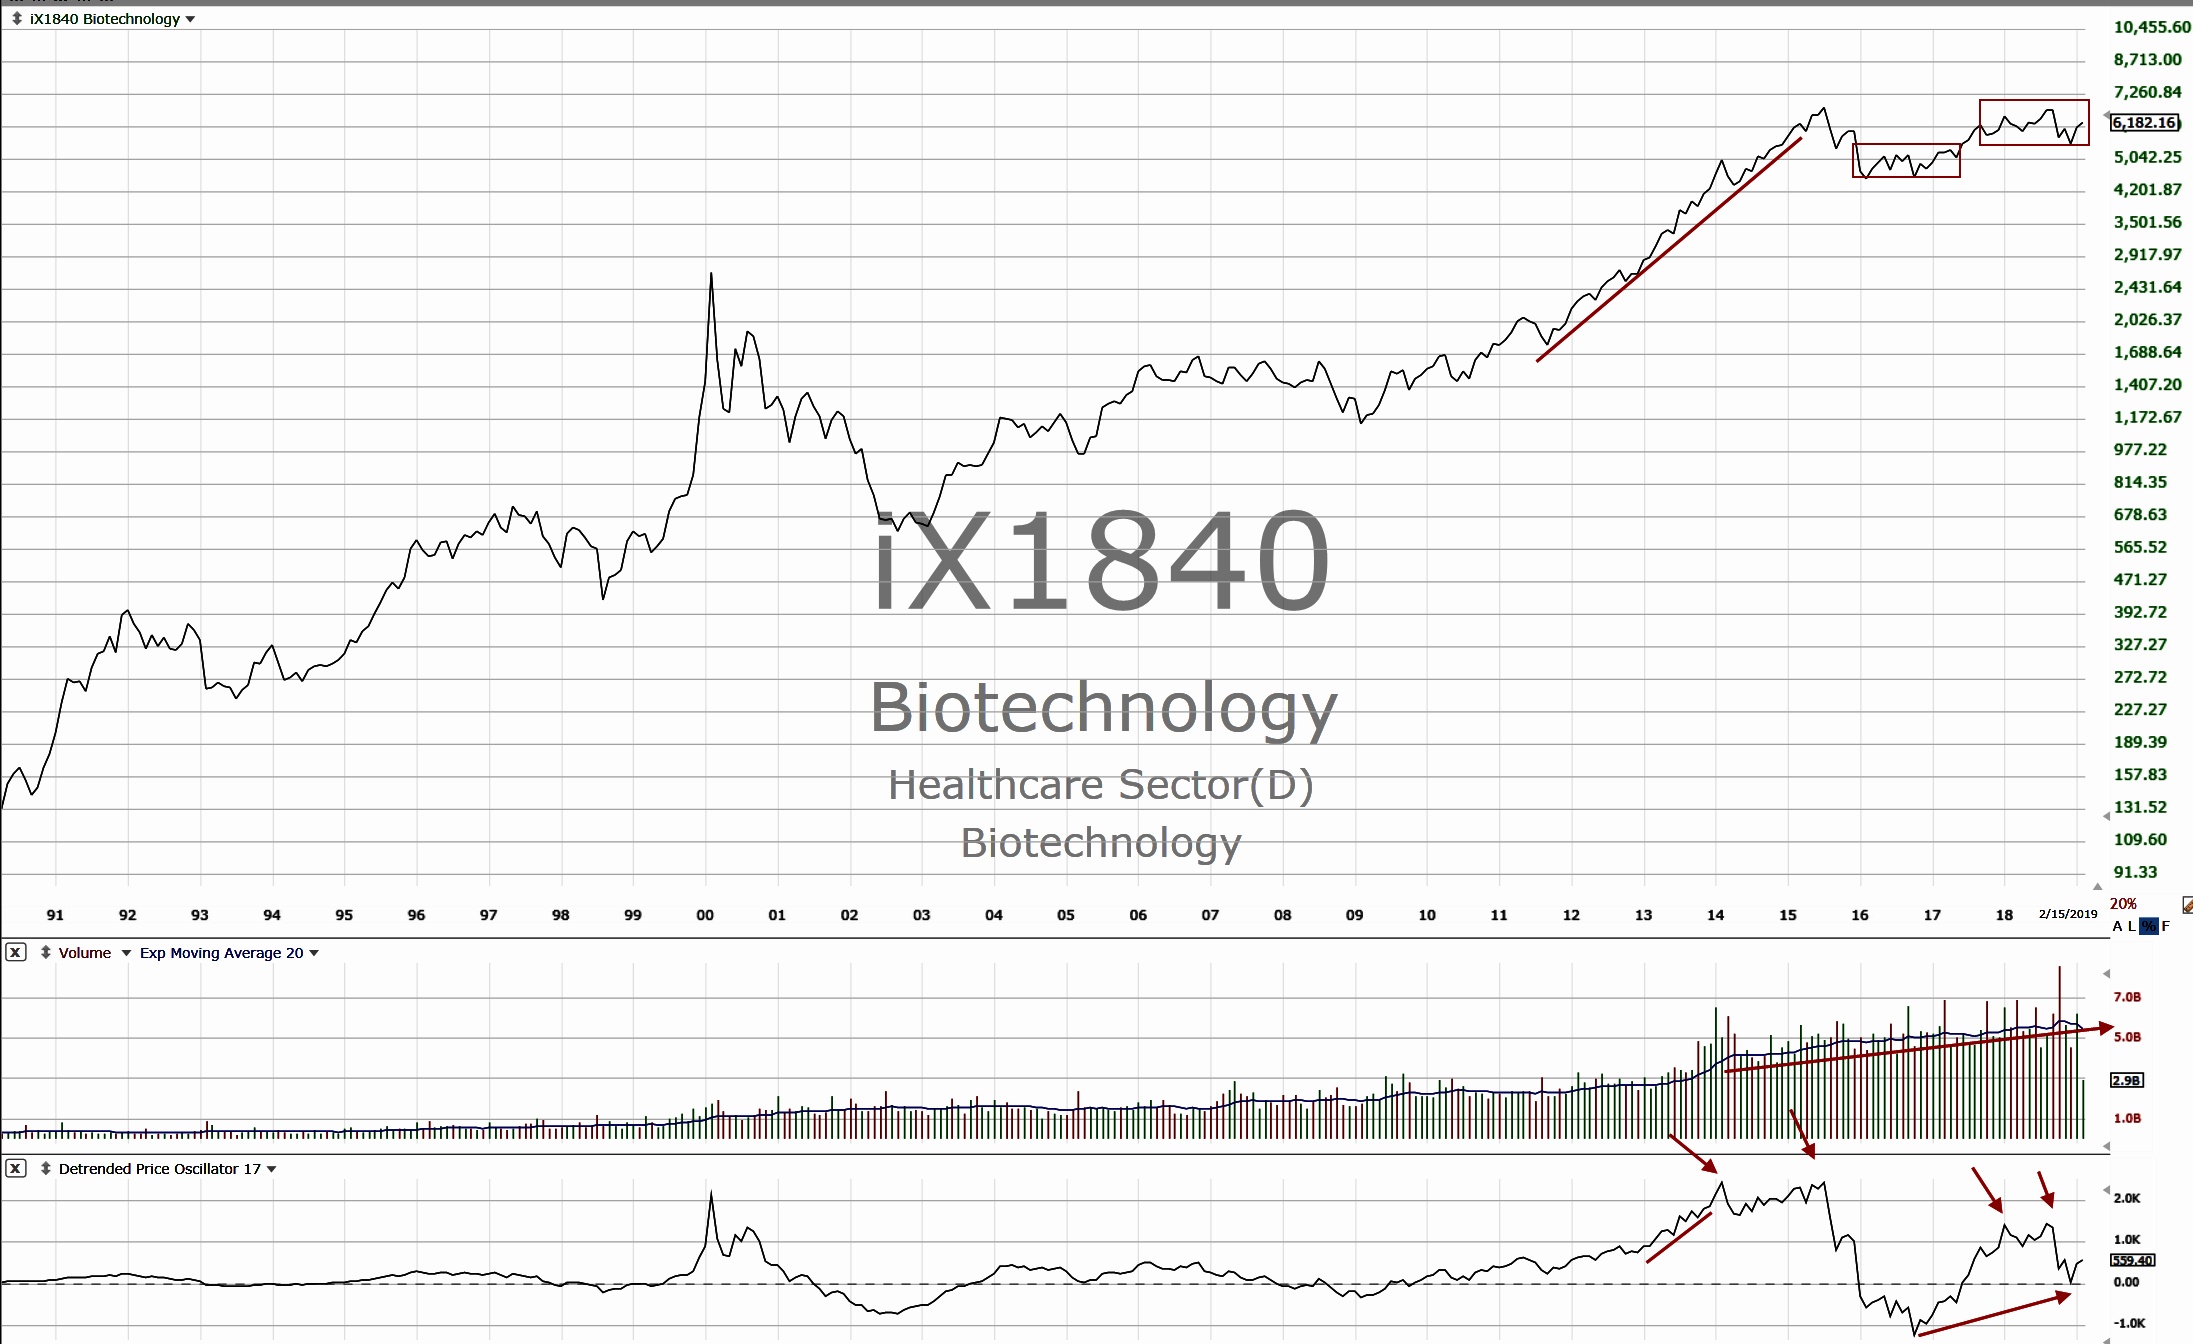
Click Image to Enlarge
Source: Technitrader.com. TC2000 chart courtesy of Worden Bros.
Line charts are best for technical analysis of the long-term trend. The chart contains the index value represented as a continuous line, month over month. In addition, it has monthly volume and the cycle indicator known as the detrended price oscillator, which removes the trend from the value chart to reveal the industry cycle.
This Biotechnology industry monthly chart has 28 years of data. Currently, the industry has been in an industry-cycle correction mode. It started in 2015 as the industry cycle peaked with an extreme deviated peak in its cycle. This was due to massive speculative investing and trading in Biotechnology stocks between 2010 and the beginning of 2015.
Stock prices went beyond what was warranted by fundamental values and financials of the companies. Technical analysis warned of the risk of a correction for many stocks in this industry. The correction is still underway, but there is improvement in the recent industry technical patterns. This is due to many bottoming formations that began in 2018 and are completing in 2019. Individual stocks within the industry appear to have quiet “accumulation bottoming,” which will show on individual stock charts first, and then later on the industry chart.
There was an extreme trough pattern followed by a failure to top, and then recently a failure to trough. This means the industry has some companies that are stronger than others. The volume for this industry has been on an upward angle of ascent, even while it has been in a sideways price correction mode. This is due to continued quiet accumulation, likely by buy-side institutions and developers for ETFs.
This chart provides ample information for investors, revealing that this industry should have many stocks that are in a recovery mode, with those bottoming formations developing at this time.
 Martha Stokes, CMT, is the co-founder and CEO of TechniTrader and a former buy-side technical analyst. Since 1998, she has developed over 40 TechniTrader stock and option courses. She specializes in relational analysis for stocks and options, as well as market condition analysis. An industry speaker and writer, Ms. Stokes is a member of the CMT Association and earned the Chartered Market Technician designation with her thesis, "Cycle Evolution Theory." technitrader.com