
Correction protection

The key to winning the game is staying in the game
In a bizarre way, professional investors’ biggest fear during this period was no longer the risk of loss, but the risk of missing out on performance. Now that quantitative easing (QE) in the U.S. has ended and global stock markets are breaking their 2009 uptrends, the risk of loss seems to be quickly becoming a priority again.
Over the past several years, Asbury Research’s clientele has shifted more heavily from mostly hedge funds and portfolio managers to financial advisors. These advisors have consistently told me that their primary concern was protecting their client assets rather than producing alpha, which was a bit of a shift from what I was accustomed to.
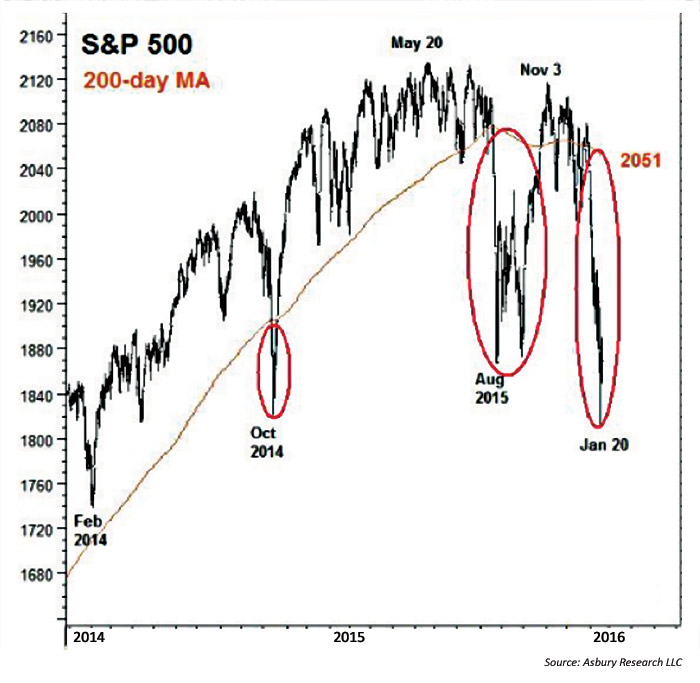
EXHIBIT 1: S&P 500 VERSUS 200-DAY MOVING AVERAGE
Building the structure for ‘correction protection’
This change in focus to help a different type of client inspired me to build a model—which we call the Correction Protection Model (CPM)—to do just that. As I was putting the model together, I started with the fundamental fact that the U.S. stock market has historically risen over time—actually by 7.5% per year less dividends over the past 100 years. If I could come up with a quantitative methodology to protect the downside, and be agile enough to get back into the market quickly once the danger passed, the upside should take care of itself.

Building a model is similar to building a house. Once I decided on what I wanted the house to look like, it was critically important to choose the correct tools to get the job done. The first step was to choose a trend-following metric that would keep me in the market as much as possible to take advantage of that long-term upward bias. Since 2007, CPM has been in the market 74% of the time, so the indicator I chose to perform this function in the model met that criterion. Moving averages, trend lines, indicators such as Moving Average Convergence/Divergence (MACD), and linear regression are just a few metrics that can be used to accomplish this. The key criterion for this step is to accurately capture your investment time horizon.
Exhibit 1 is a very simple example of this. It plots the S&P 500 (SPX) daily since 2014 and the 200-day moving average of its daily closing level. The chart shows that this metric, a widely watched major-trend proxy, captured the entire rise from January 2014 to May 2015, while flagging the October 2014, August–September 2015, and January 2016 declines. (Admittedly, Q4 of 2015 presented some challenges for most models.)
Next stage—determining reentry points
The next, and more difficult, steps are determining (a) when the corrective period is reaching exhaustion and (b) when the bullish trend is resuming. Technically oversold extremes, extremes in investor sentiment, and spikes in trading volume are a few metrics that can indicate exhaustion.
EXHIBIT 2: S&P 500 AND NYSE VOLUME PATTERNS
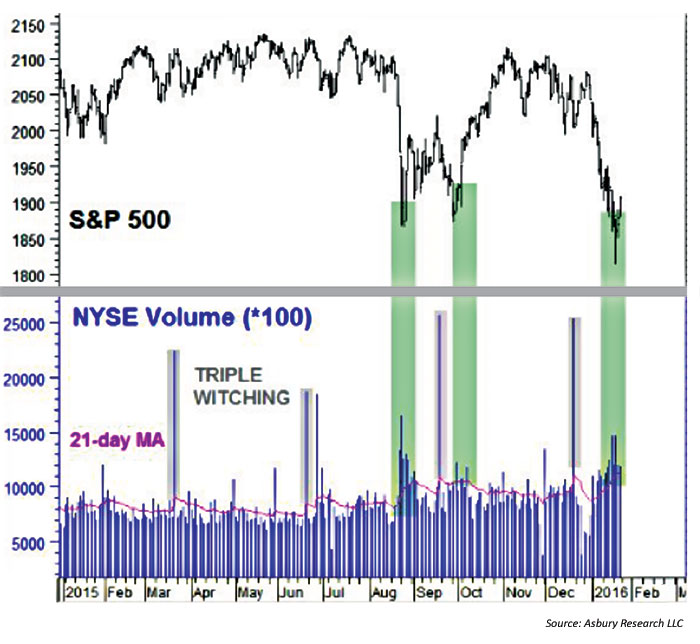
Exhibit 2 shows that, with the exception of one-day volume spikes during triple-witching days (an event that occurs when the contracts for stock-index futures, stock-index options, and stock options all expire on the same day), elevated NYSE volume during late August and late September preceded the rebounds in the S&P 500 during those periods. Note that another such period of elevated volume occurred in mid-to-late January.
Now that we have determined that conditions are conducive to the uptrend resuming, the final step is choosing a metric to indicate when it actually does. This should be another trend-following tool, but one that is shorter term in an effort to give back as little as possible of the market downside we initially avoided.
 The key takeaway is that just one easy-to-monitor trend-following tool, which can be as basic as a moving average, could have protected client portfolios from most of the destruction that occurred in 2008. This sort of approach (greatly simplified here) can also mitigate risk in the next bear market that will inevitably emerge, especially now that QE in the U.S. is officially over.
There is a much greater likelihood that those relatively minor 4–6% “buy-the-dip” downturns of the past five years will present a higher risk of deeper corrections in the coming period of rising interest rates. As the FOMC itself has more or less admitted, the impact of emerging from a duration of extremely low rates and unprecedented quantitative easing is a relative unknown.
Adding a good reentry component to the defensive strategy is admittedly more difficult, but is the icing on the cake that can take advantage of market declines to buy financial assets at a discount—often when everyone else is selling. Most important, the repeatable and quantitative nature of this kind of methodology keeps investors true to their plans during stressful situations—when even the most seasoned professionals make fear- and greed-related mistakes.
 John Kosar, CMT, is chief market strategist and director of research at Asbury Research, which provides institutional research services. Mr. Kosar has more than 30 years of experience analyzing and forecasting global financial markets, having worked as a trader and analyst for several leading Wall Street firms. He is a past member of the board of directors of the Market Technician’s Association (now the CMT Association), is a featured speaker at many financial conferences, and is frequently quoted in the financial press. asburyresearch.com