

The third-quarter earnings season kicked off in earnest this week, but going-in expectations were for a lackluster performance. According to one analyst interviewed this week on Bloomberg Radio, the lack of clarity across many geopolitical issues is a major factor impacting the willingness for corporations to invest in their businesses, and, “One thing is certain—CEOs don’t like uncertainty.”
CNBC reported,
Data analytics firm FactSet has a slightly more negative outlook for Q3 S&P 500 earnings, providing the following outlook on October 11:
“Earnings Growth: For Q3 2019, the estimated earnings decline for the S&P 500 is -4.6%. If -4.6% is the actual decline for the quarter, it will mark the first time the index has reported three straight quarters of year-over-year earnings declines since Q4 2015 through Q2 2016.
“Earnings Revisions: On June 30, the estimated earnings decline for Q3 2019 was -0.6%. All eleven sectors have lower growth rates today (compared to June 30) due to downward revisions to EPS estimates.
“Earnings Guidance: For Q3 2019, 83 S&P 500 companies have issued negative EPS guidance and 30 S&P 500 companies have issued positive EPS guidance.
“Valuation: The forward 12-month P/E ratio for the S&P 500 is 16.6. This P/E ratio is equal to the 5-year average (16.6) but above the 10-year average (14.8).
“Earnings Scorecard: For Q3 2019 (with 23 of the companies in the S&P 500 reporting actual results), 21 S&P 500 companies have reported a positive EPS surprise and 12 S&P 500 companies have reported a positive revenue surprise.
“Revenue Growth: The estimated (year-over-year) revenue growth rate for Q3 2019 is 2.7%, which is below the 5-year average revenue growth rate of 3.5%. If 2.7% is the actual growth rate for the quarter, it will mark the lowest revenue growth rate for the index since Q3 2016 (also 2.7%).”
FIGURE 1: S&P 500 EARNINGS GROWTH/DECLINE BY SECTOR (Q3 2019 EST.)
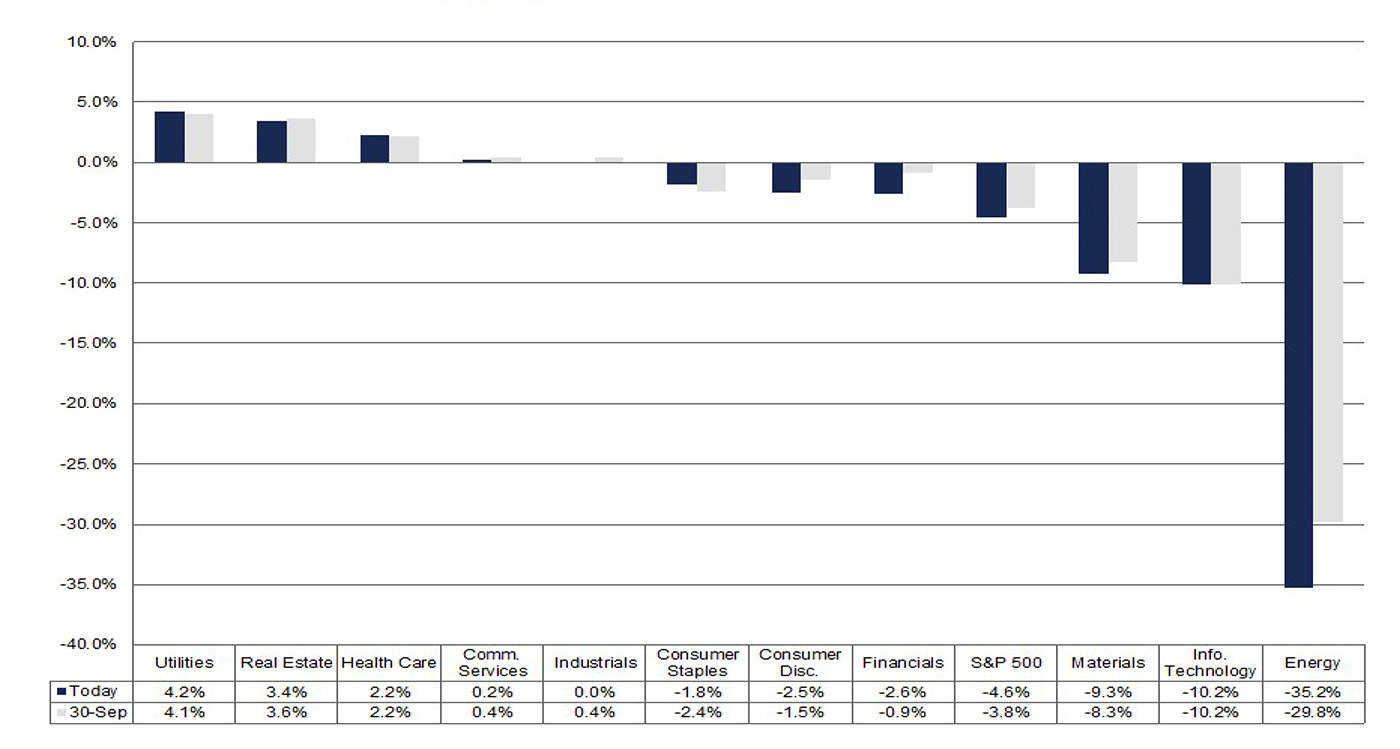
Source: FactSet
FIGURE 2: S&P 500 REVENUE GROWTH/DECLINE BY SECTOR (Q3 2019 EST.)
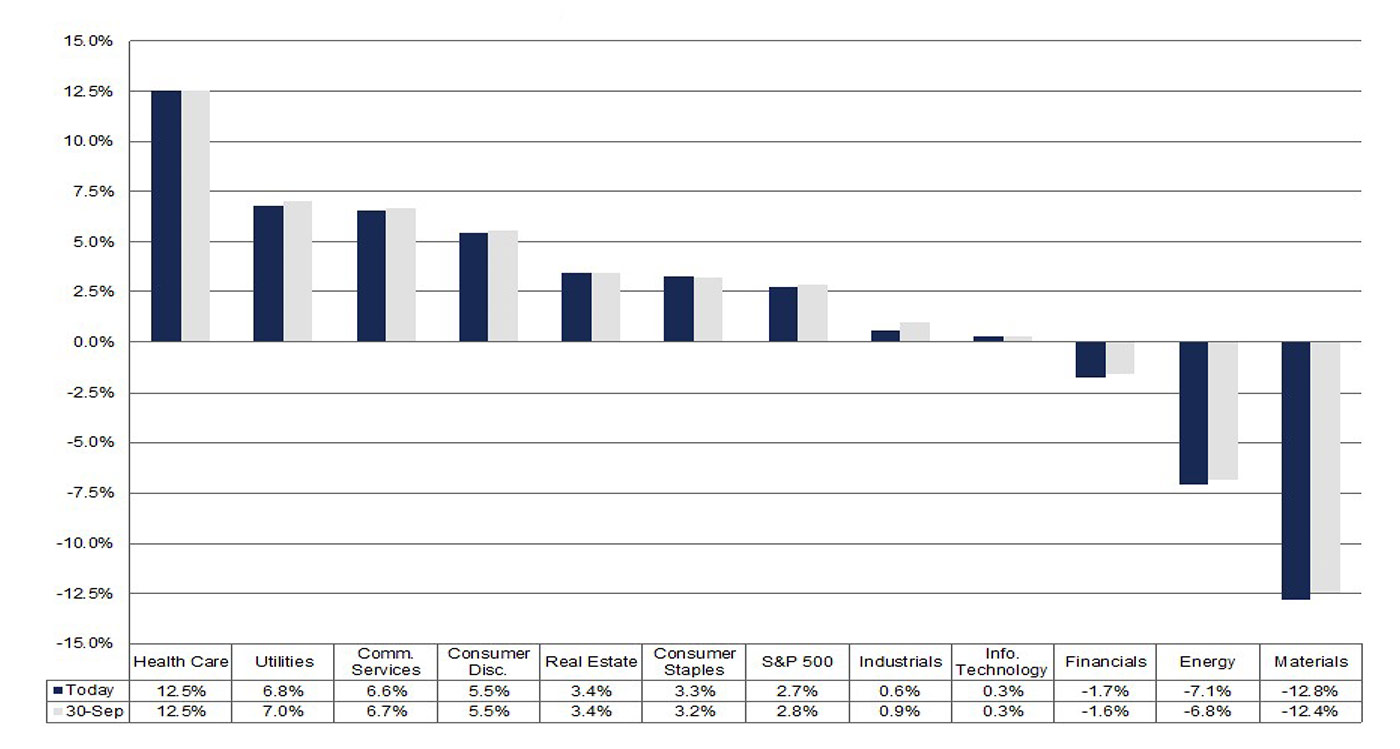
Source: FactSet
Despite the current earnings outlook for Q3 2019, FactSet has some more positive estimates moving forward:
This improved earnings picture has led to a “bottom-up” analyst forecast for a rally in the S&P 500 over the next 12 months, says FactSet:
“The value of the S&P 500 has increased by 17.2% since the start of the year. Where do industry analysts believe the price of the index will go from here?
“Industry analysts in aggregate predict the S&P 500 will see a 13.0% increase in price over the next twelve months. This percentage is based on the difference between the bottom-up target price and the closing price for the index as of yesterday (October 10). The bottom-up target price is calculated by aggregating the median target price estimates (based on company-level estimates submitted by industry analysts) for all the companies in the index. On October 10, the bottom-up target price for the S&P 500 was 3321.32, which was 13.0% above the closing price of 2938.13.”
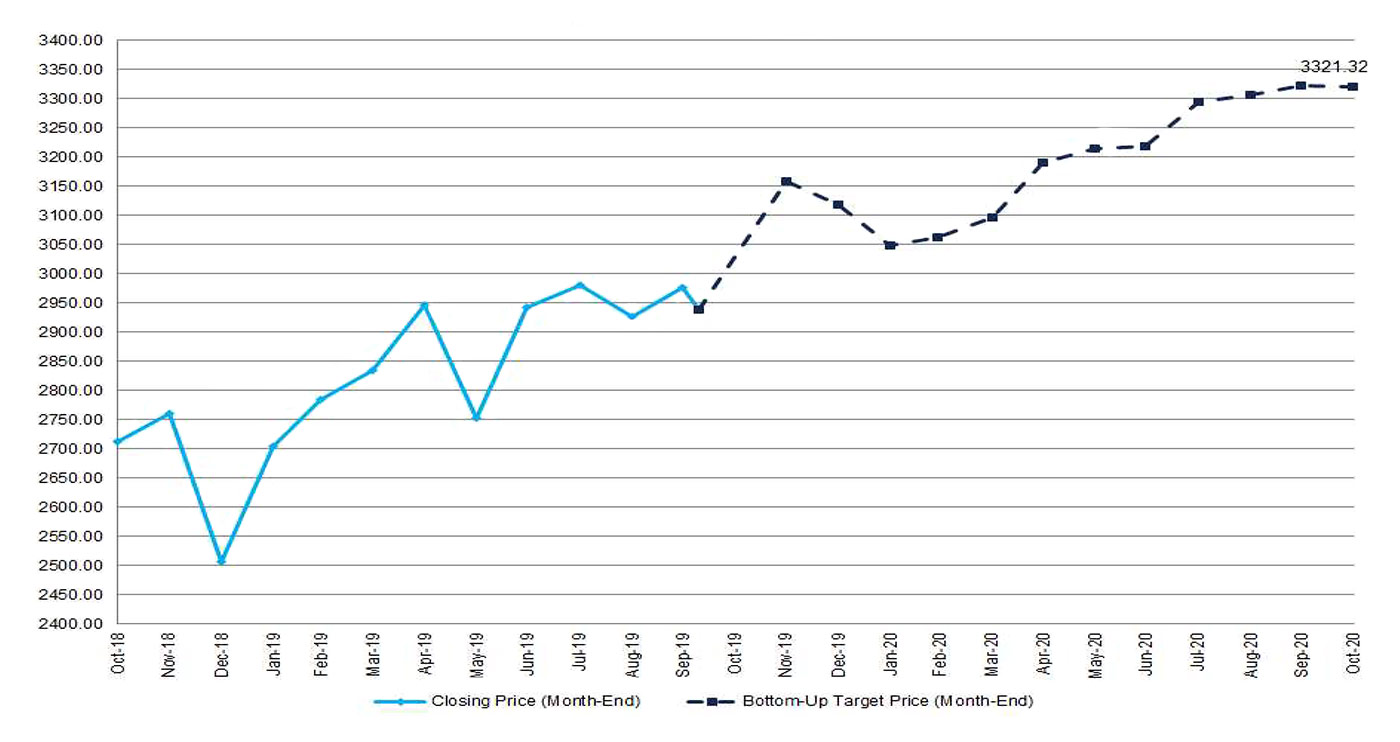
Source: FactSet
A 12-month increase of 13% in the S&P 500 would be impressive, and it would certainly break with the current trend of a range-bound market. As Figure 4 from Bespoke Investment Group shows, “U.S. equities have collectively done a whole lot of nothing over the last 18 months, and if you thought policy in Washington was at a standstill, it has nothing on the stock market. Despite some big short-term moves, the S&P 500 is currently at the same levels it was at last month, three months ago, six months ago, and one year ago.”
Bespoke adds,
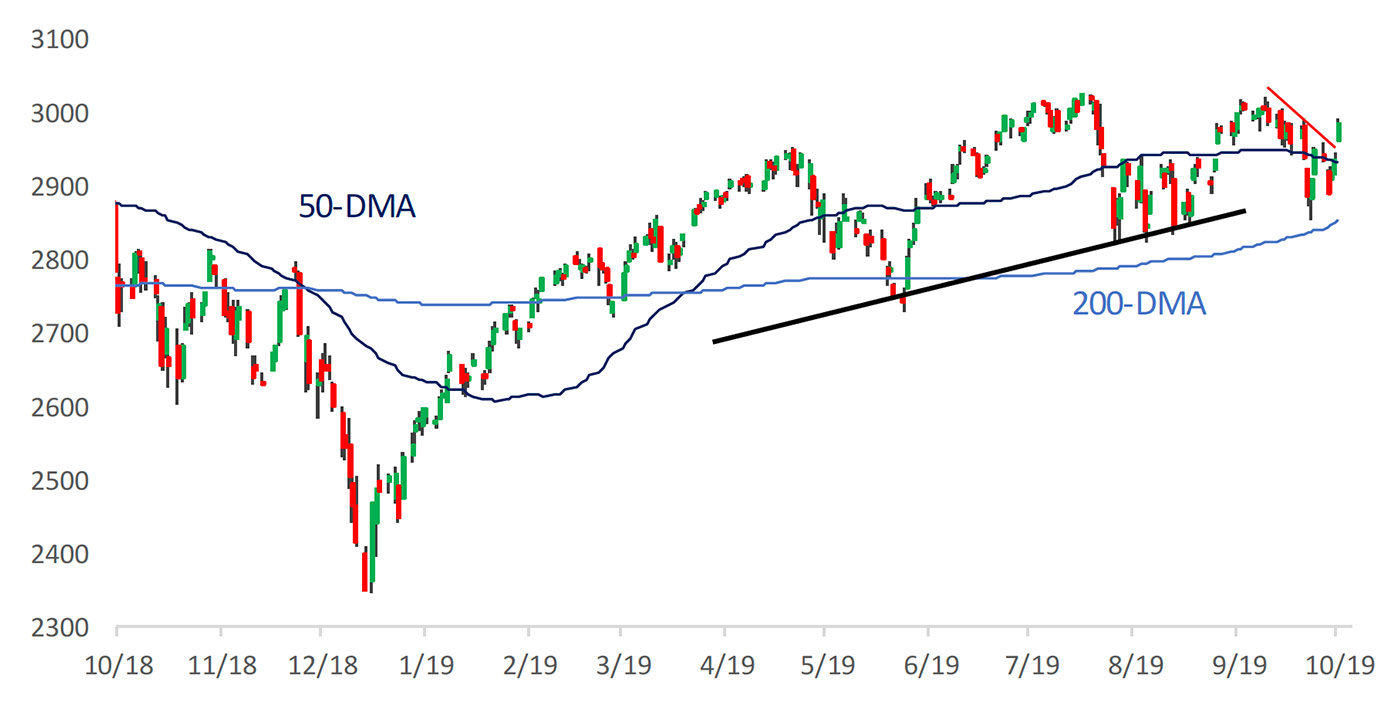
Source: Bespoke Investment Group