

Equity markets responded very positively to last week’s employment report from the Bureau of Labor Statistics (BLS), which showed total nonfarm payroll employment rising by 266,000 in November and the unemployment rate little changed at 3.5%. Significant job gains occurred in health care and professional and technical services.
According to the BLS, “Manufacturing employment rose by 54,000 in November, following a decline of 43,000 in the prior month. Within manufacturing, employment in motor vehicles and parts was up by 41,000 in November, reflecting the return of workers who were on strike in October.”
Additionally, the change in total nonfarm payroll employment for September was revised up by 13,000 to 193,000, and the change for October was revised up by 28,000 to 156,000. The labor force participation rate was little changed at 63.2% in November. Says the BLS, “Job growth has averaged 180,000 per month in 2019, compared with an average monthly gain of 223,000 in 2018.”
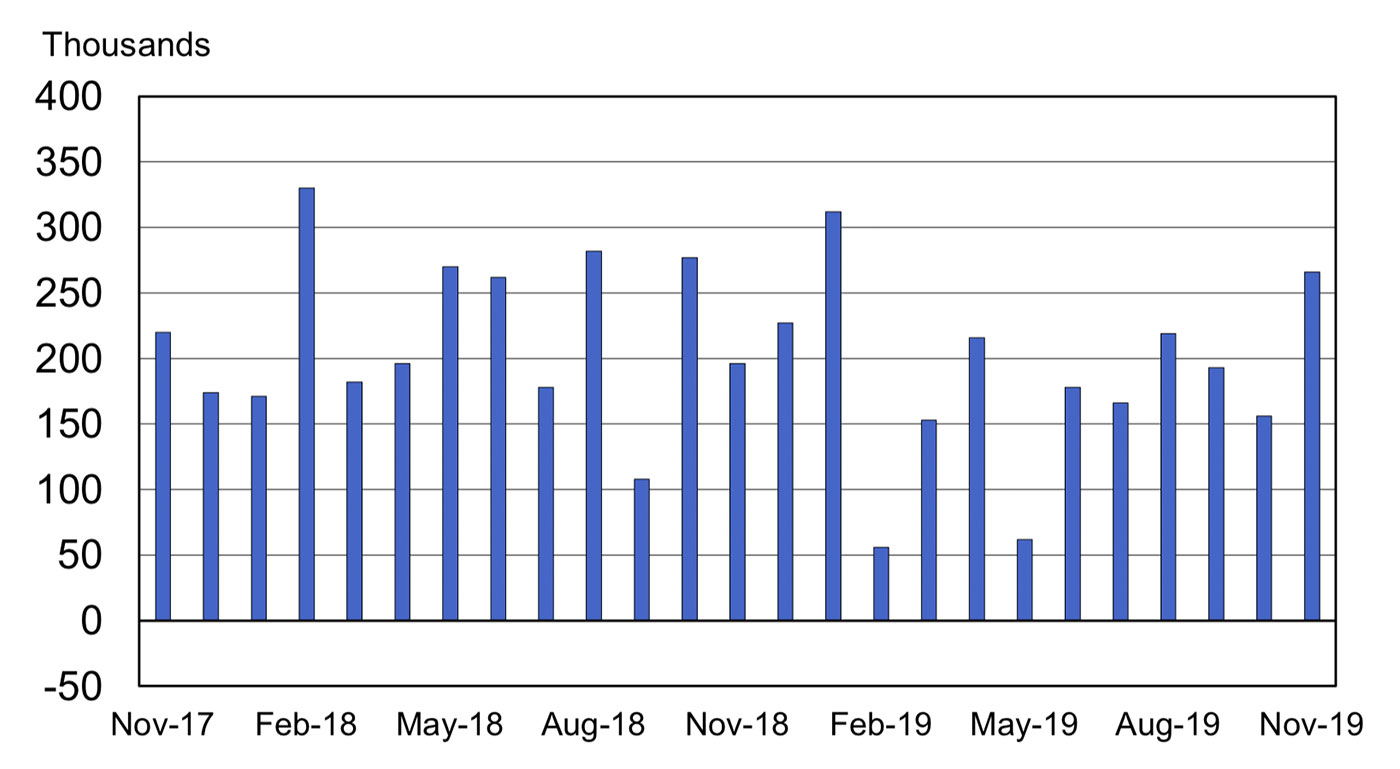
Source: Bureau of Labor Statistics
With the employment situation showing some renewed strength, what about some other economic factors heading into the new year?
According to Bespoke Investment Group,
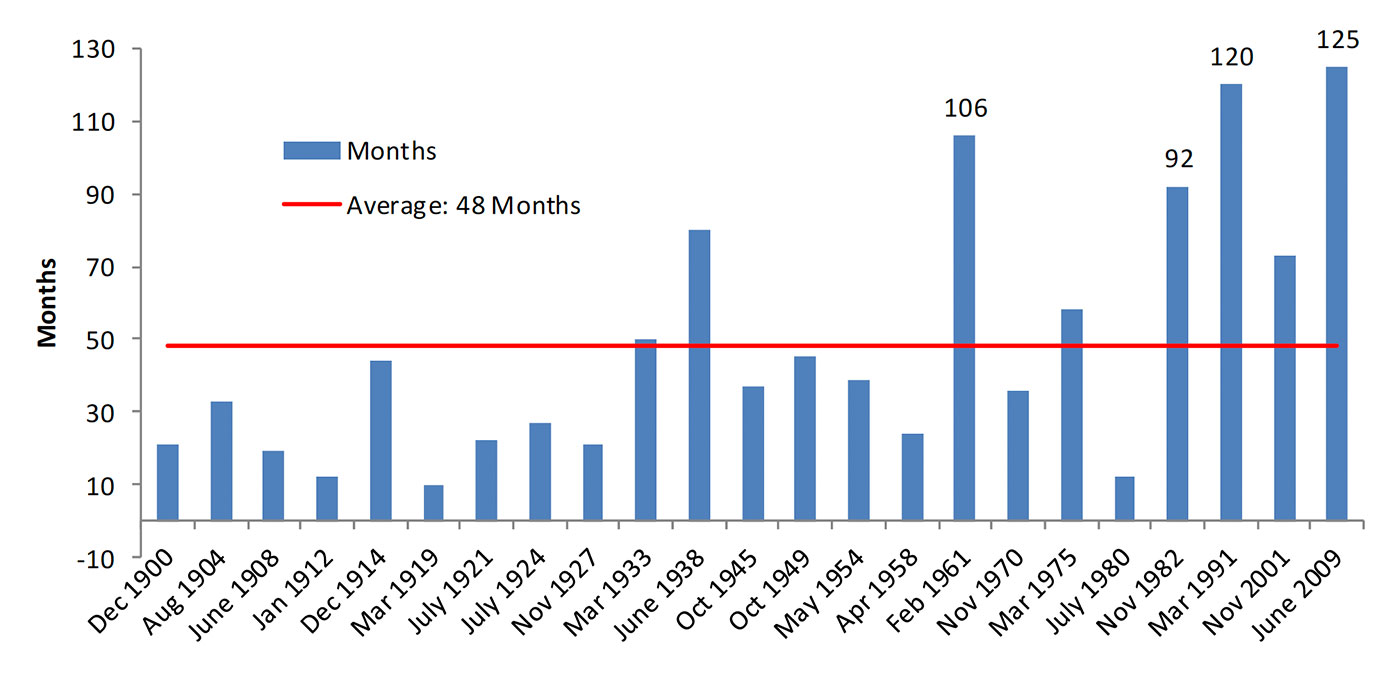
Source: Bespoke Investment Group
FIGURE 3: UNITED STATES ANNUAL GDP GROWTH RATE
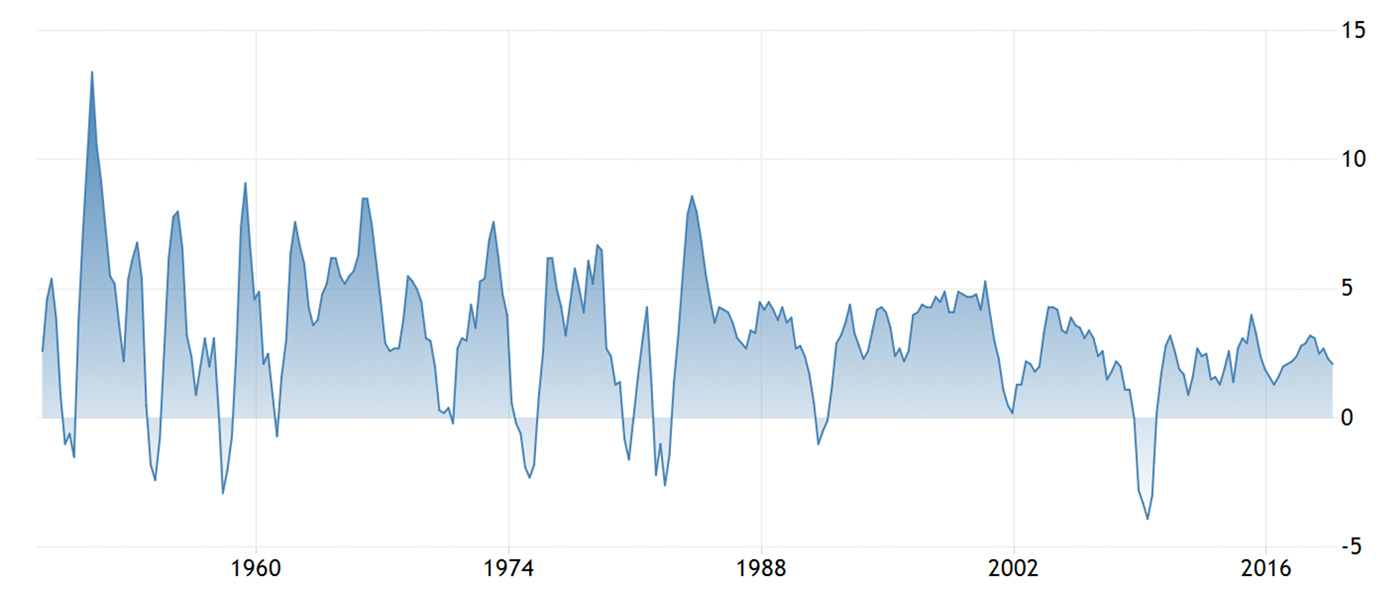
Source: Trading Economics, U.S. Bureau of Economic Analysis
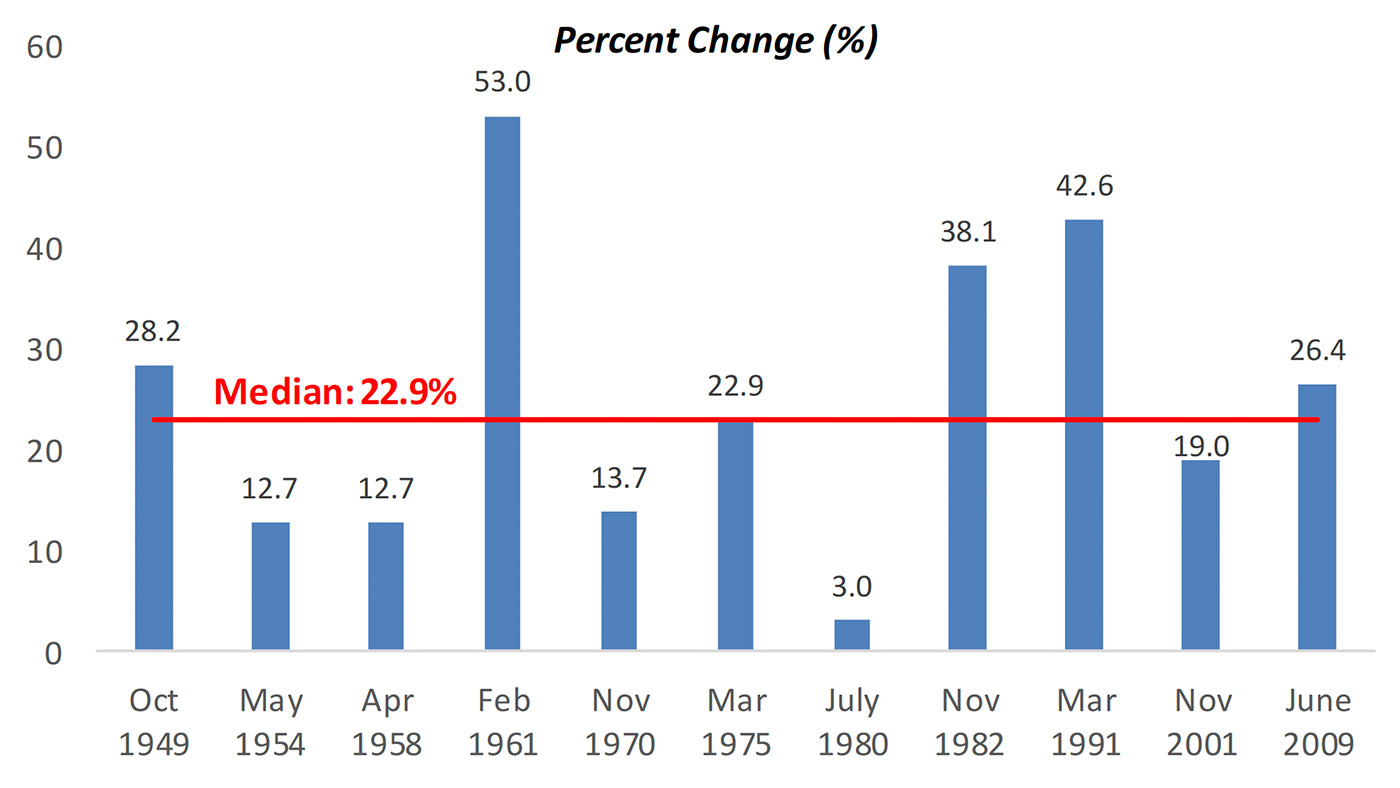
Source: Bespoke Investment Group
Consumer sentiment, as measured by the University of Michigan, continues to hold strong and has bounced back in the second half of 2019 to levels near the highs for the post-2009 cycle.
Trading Economics writes,
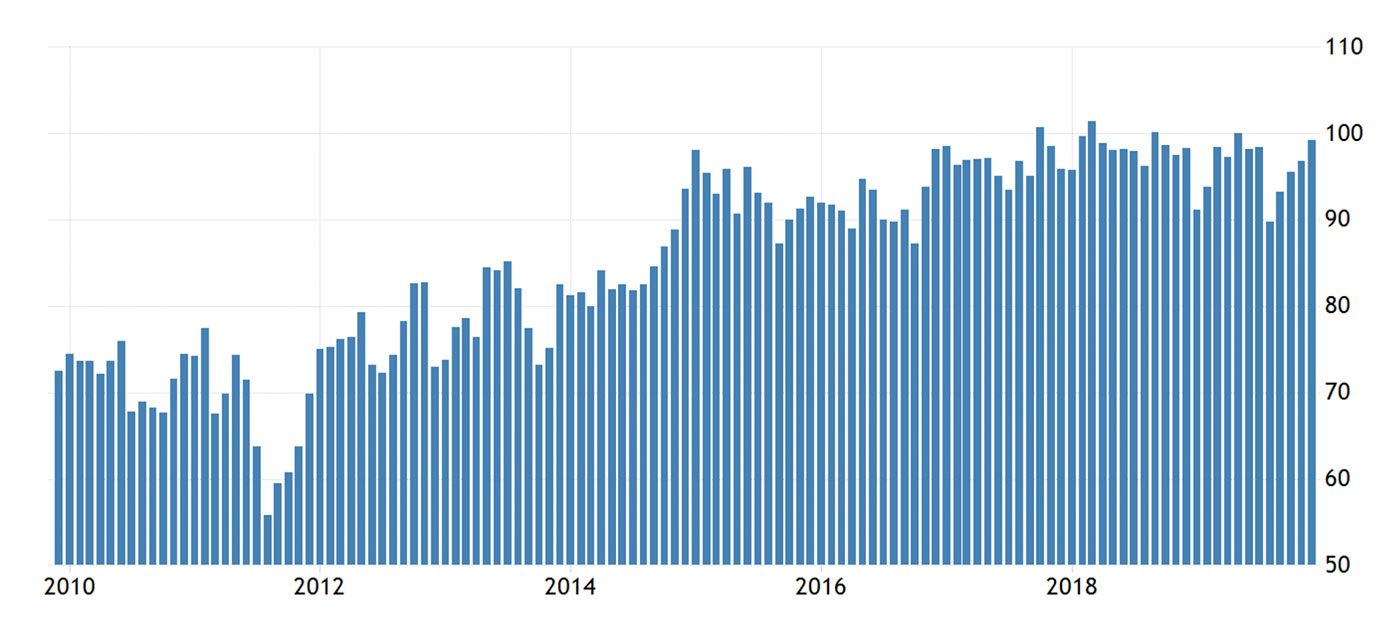
Source: Trading Economics, University of Michigan
“One of the most concerning of the recession indicators we track is the spread in Consumer Confidence between Present Conditions and Expectations. Ever since early 2015, sentiment towards current conditions has been surging while sentiment towards the future has stalled. The result is a widening gap between the two indicators to levels not seen since the dot-com boom.
“As shown in the chart below [Figure 6], in every period but one where the spread reached 50, a recession was soon to follow, and even during the dot-com period where a recession wasn’t quick to follow, one ultimately arrived three years after the ratio first hit 50. It has now been a full two years since the ratio first hit 50 this time around, so once the spread starts to roll over, history would suggest that the economy will start to face problems.”
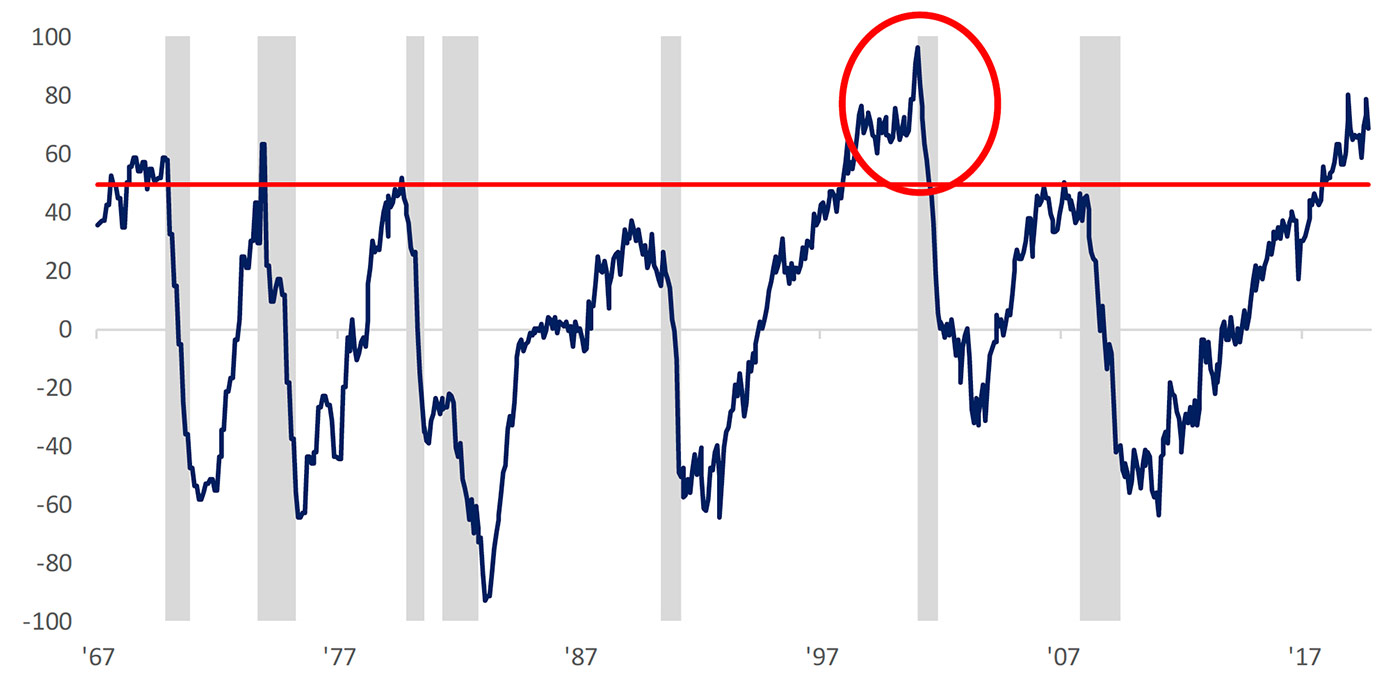
Source: Bespoke Investment Group
Of course, there are many other factors that could be used to evaluate the state of the U.S. economy heading into 2020: leading and coincident economic indicators, business confidence and investment, manufacturing data, the situation with inflation and interest rates, the housing market, wage growth and consumer spending, the state of the auto and financial sectors, the global economic trend, and countless other data points.
Guggenheim Investments has been consistently forecasting better-than-even chances for a recession in the next two years throughout much of 2019. As recently as September, the firm wrote:
- “Historical evidence on the Federal Reserve’s skill in using rate cuts to avoid recession is mixed. This time around, numerous headwinds combined with limited policy space globally mean it is a close call as to whether the Fed has cut early enough to help extend the expansion.
- “The odds of a recession both in the near and medium term rose in the second quarter. This trend continued in the third quarter, according to our preliminary estimate, with our Recession Probability Model showing a 58 percent chance of the economy being in a recession by mid-2020, and a 77 percent chance of a recession beginning in the next 24 months.
- “History shows that once our recession forecast model reaches current levels, only aggressive policy action can delay recession, but not avoid it.”
Guggenheim struck a far more optimistic note on Dec. 9, 2019:
“We continue to believe the Bull Market remains intact and that further upside is likely in the quarters ahead. While the probability of a recession in the coming year has diminished significantly (although it is not zero), forward equity market gains are likely to be much more modest than what we have experienced this year.
“The [2019] rally has been driven almost exclusively by the expansion in the market’s P/E multiple, which in turn, has raised concern that valuation levels are looking a bit elevated relative to underlying earnings growth. After very little earnings growth during the current year, earnings will need to be the key driver of forward returns. According to FactSet, earnings are expected to rebound in 2020 with current consensus expectations calling for 9.8% growth.”