

With the arrival of September 2018, articles in the business press have started to trickle out on the 10th anniversary of the Great Recession. September 2008 might not have technically been its beginning, but a look back at an article from The Wall Street Journal from October 2008 indicates that economic data from that month were a harbinger of what was to come:
“Fears of a deep recession sparked the worst drop in the Dow Jones Industrial Average in 21 years, as retail sales tumbled, demand for commodities sank and bank earnings fell. … U.S. retail sales dropped 1.2% during September, the sharpest drop in three years. WSJ’s Sudeep Reddy says the decline signals the economy is already in recession and that it is facing a much deeper hit from the credit sector turmoil.”
What a difference a decade makes!
Whether one is inclined to fully credit the Trump administration’s actions or see this late cycle recovery as the inevitable result of prior policies, there is no denying that many aspects of recent economic data have been impressive:
- July 2018 retail sales topped estimates with a 0.5% monthly increase versus a year ago, and the trend line continues in a positive direction for the year.
FIGURE 1: RETAIL SALES
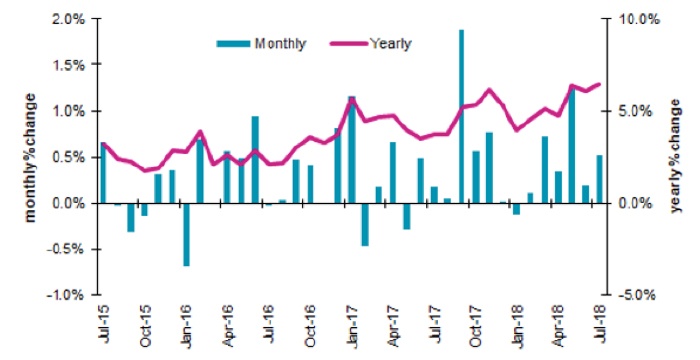
Source: Barron’s, Econoday, Haver Analytics, U.S. Bureau of the Census
- Consumer spending rose 0.4% in July, which was at the top of the estimated range.
- While the University of Michigan’s consumer sentiment reading has faded slightly from the first quarter (at 96.2 for August), it is still in very healthy territory and above consensus expectations. The Conference Board reported that in its last survey “consumer confidence increased to its highest level since October 2000 (Index, 135.8), following a modest improvement in July.”
- Jobless claims continue to trend lower, and the overall unemployment rate stands at 3.9%. Initial claims in the week of September 1 fell 10,000 to 203,000 with the four-week average down 2,750 to 209,500—both the lowest results since the December 6 week back in 1969, according to Barron’s. The employment report released on September 7 also showed that private-sector hourly wages grew 2.9% from a year earlier, which was the highest annualized increase since 2009.
FIGURE 2: NEW JOBLESS CLAIMS WITH 4-WEEK MOVING AVERAGE
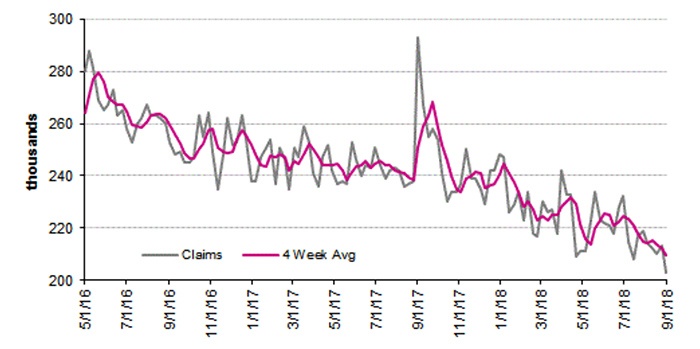
Source, Barron’s, Econoday, Haver Analytics, U.S. Dept. of Labor
- According to National Federation of Independent Business (NFIB), the Small Business Optimism Index rose by 0.9 points in August to 108.8, a new record in the survey’s 45-year history. The NFIB says that “job creation plans and unfilled job openings both set new records.”
- Leading economic indicators published by The Conference Board were at the top of the expected range for July. Said Barron’s, “This strength offers a favorable indication for the second-half economy.”
- Kiplinger notes in its business investment forecast for the rest of the year, “A 7% pickup in business spending will be moderate by historical terms but will top last year’s 5.3% gain, showing strength in the nation’s industrial sector.” The wild card here is the impact of the continuing tariff/trade wars, which could resolve quite positively or resoundingly negatively.
- The latest look at GDP growth for the second quarter also came in at the top of the range at 4.2% and has been trending higher on an annualized basis since early 2016. The Institute for Supply Management (ISM) survey reports for the manufacturing and nonmanufacturing sectors that were released last week both exceeded consensus expectations, giving further credence to continued GDP improvement.
FIGURE 3: ISM MANUFACTURING INDEX (AUGUST 2018)
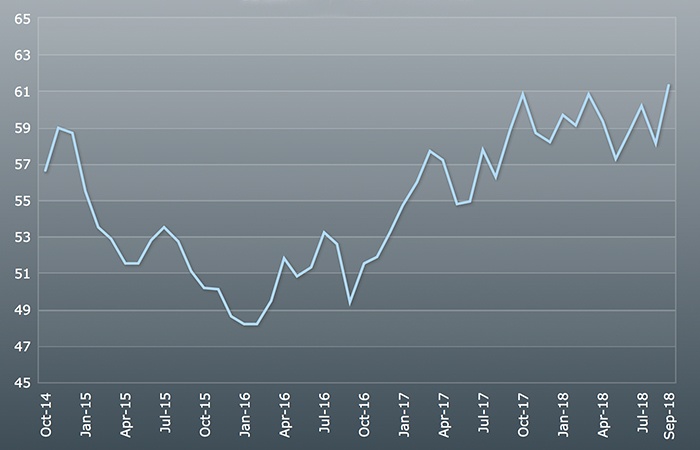
Sources: Barron’s, Haver Analytics, Econoday, Institute for Supply Management
FIGURE 4: U.S. GDP GROWTH
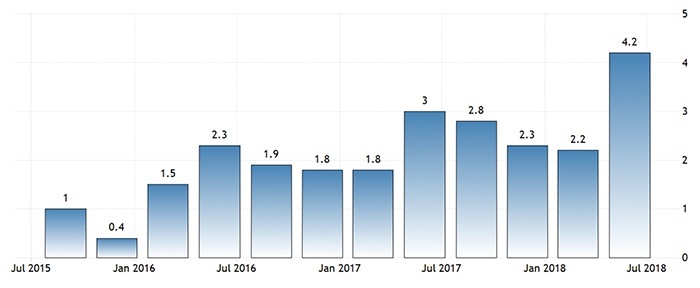
Sources: Tradingeconomics.com, U.S. Bureau of Economic Analysis
- In the Federal Reserve’s minutes from their July 31–August 1, 2018 meeting, they said, in part, “labor market conditions continued to strengthen in recent months and … real gross domestic product (GDP) rose at a strong rate in the first half of the year.”
Not all is perfect, of course, and some important economic indicators and reports have had uneven performance this year. The longer-term trend in productivity growth continues to disappoint most analysts, the auto industry has been seeing a global slowdown in new vehicle sales, and the U.S. housing market has been inconsistent. Perhaps most troubling, consumer debt is at all-time highs, according to American Banker, and “the personal savings rate dropped to 2.4%, its lowest level since the debt-fueled boom of the mid-2000s.”
Additionally, questions abound from many corners on whether recent economic growth is a function of short-term impacts from the tax cuts, business-friendly deregulation, and the continuation of historically low interest rates this late in the business cycle—all factors which may not be duplicated going forward. Barron’s noted recently, “The Economic Cycle Research Institute’s array of indicators point to a ‘stealth cyclical slowdown.’”
That said, U.S. equity markets, which common wisdom asserts reflect the outlook for the next six months or longer, seemingly have voted positively for the time being on the intermediate-term economic outlook and continued strength in corporate earnings.