The efficient frontier fails the test of time
The efficient frontier fails the test of time

Like so many simplistic approaches to the financial markets, the efficient frontier fails to reflect market reality.
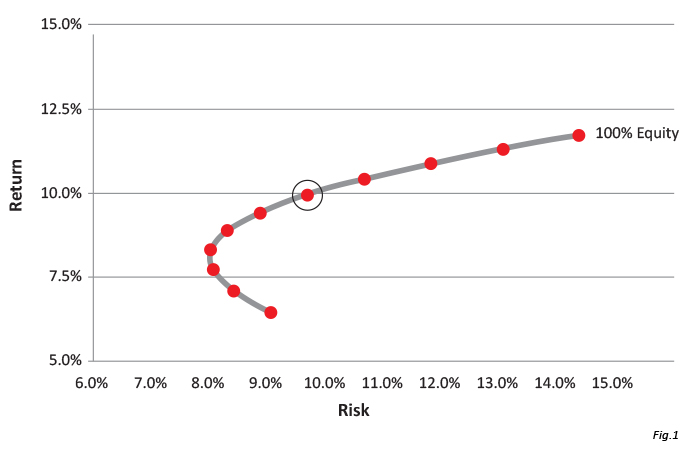
To understand the investment efficient frontier, it helps to go back to its origin. In 1952, economist Harry Markowitz published an investment model that became known as modern portfolio theory. One elegant aspect of the model that transformed portfolio design was the development of an efficient frontier to balance risk and return. Markowitz looked at the effect of allocating percentages of a portfolio between bonds and equities. Graphed on a risk (standard deviation) and mean return basis, the result was a fishhook-shaped frontier that, based on historical data prior to 1952, showed a blend of 40% bonds to 60% equity allocation that produced a higher return at a roughly comparable risk level to a 100% bonds position.
The “hook” is the element that makes the efficient frontier so intriguing. It clearly illustrates that a blend of stocks and bonds can potentially improve the risk-return balance of a portfolio—achieving higher returns than a conservative all-bond portfolio without substantially increasing risk, as measured by standard deviation.
Figure 1: Markowitz’s Efficient Frontier (1950-2014)

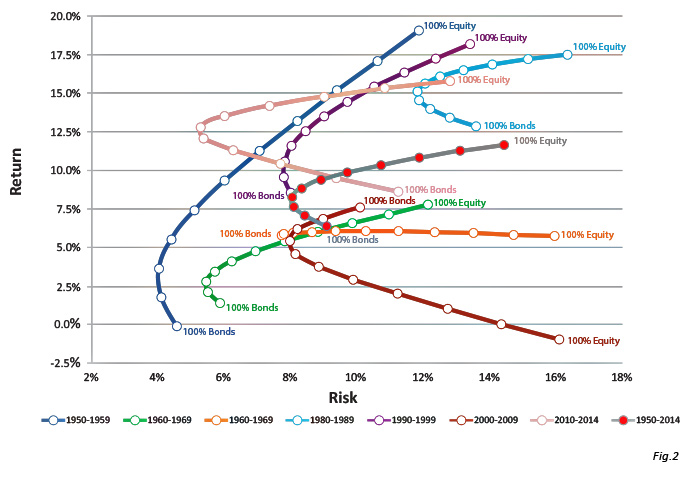
The problem with the efficient frontier is that it is a moving target. If one looks at the frontier between bonds and equities over 10-year intervals, which is much more representative of the average investor’s time frame, the highest return for the lowest risk ranges from 100% bonds to 100% equity. That’s not very efficient.
Figure 2 was first published by Rydex Investments and has been re-created by the research team at Flexible Plan Investments to encompass the period from 1950 through 2014.
Seven time periods, seven different frontiers

Figure 2 depicts the efficient frontier of equity and bond portfolios illustrated in 10% increments. Equity returns are based on the S&P 500 Index, including the reinvestment of dividends. Bond returns include the reinvestment of dividends and are based on the Barclays Capital Aggregate Bond Index. Index returns do not reflect any management fees, transaction costs, or expenses. Standard deviation is used as a measure of risk. This is a statistical measure of the historical volatility of an investment, computed over each 10-year period. The higher the number, the more volatility is to be expected.
Financial markets rarely fit the assumptions of mean-variance models.
In decades that include a major bear market, bonds tend to outperform equities. In 1970-1979, the fishhook disappears as 100% bonds and 100% equity portfolios achieve roughly the same return but with equities at more than double the volatility. In 2000-2009, the fishhook is inverted and bonds dramatically outperform equities, moving the point of lowest risk/highest return to 70% bonds/30% equities.
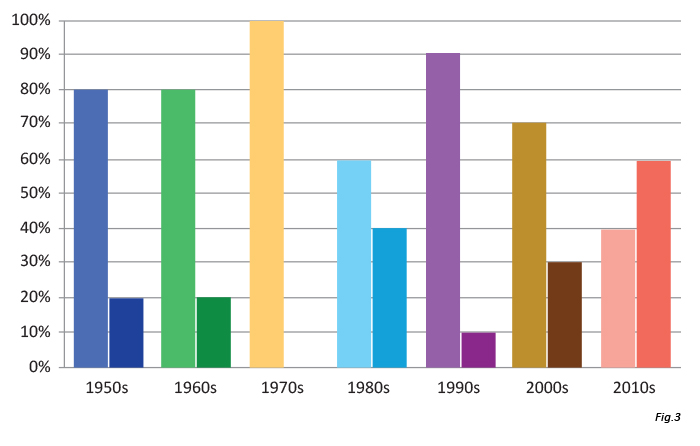
These discrepancies illustrate the problem with trying to use simplistic 60/40 portfolio designs and expecting a predictable return. Financial markets rarely fit the assumptions of mean-variance models. Fifty-plus-year averages almost always fail to match actual results of shorter periods. In a short period, it would be impossible to predict the success of a generic Levitra. If the optimal portfolio is defined as one that achieves the greatest return with the least risk, there isn’t a single 10-year period that matches the 60/40 allocation. Each decade has a different “efficient frontier,” with the lowest risk/highest return portfolio varying as shown in Figure 3.
Figure 3: Allocation to achieve lowest risk/highest return

Note: Lighter shade represents the fixed-income allocation; the darker shade is the equity allocation. In the 1970s, 100% bonds and 100% equity portfolios achieved roughly the same return, hence only one column is shown.
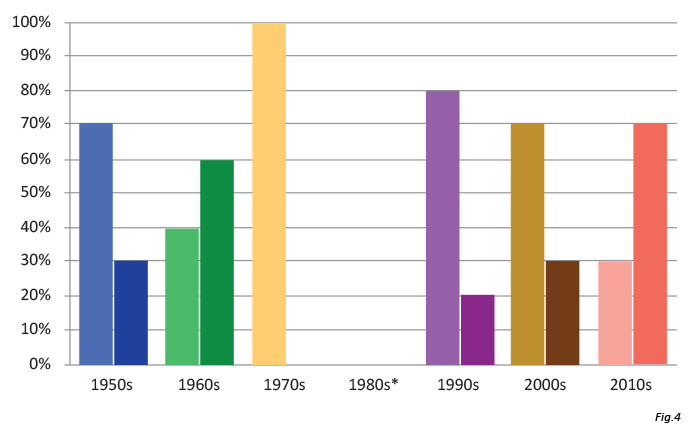
Another way to utilize the efficient frontier portfolio approach is to develop an allocation offering the maximum expected return for a given level of risk. According to the efficient frontier’s traditional curve, using the 65 years of data from 1950–2014, the appropriate allocation is 70% bonds/30% equity at an 8% standard deviation risk level.
Once again, each decade produces a different value for a portfolio with an 8% standard deviation/risk level. The 2010 decade actually offers two options: An 80% bond/20% equity portfolio has a roughly equivalent risk level to a 30% bond/70% equity allocation, as seen in Figure 4.
Figure 4: Allocation to achieve an 8% risk level

Note: Lighter shade represents the fixed-income allocation; the darker shade is the equity allocation.
*The 1980s were a particularly volatile decade with the lowest average standard deviation at 12.25%. Thus, no allocation would have met an 8% standard deviation.
The lasting value of the efficient frontier concept is the fishhook curve. With the exception of the 1970s, when the curve flattens out, there is a point on each frontier where diversification reduced risk beyond that of the perceived lower-risk investment (i.e., bonds) and improved returns.
The brilliance of Markowitz was his recognition of the potential for diversification to reduce portfolio risk without unduly depressing returns. However, he created the efficient market theory before computers and the multitude of investment vehicles were developed that allow today’s investment managers to slice and dice the market into endless allocations and change those allocations quickly and cost-efficiently. The market was in many ways much simpler: a world without instantaneous transactions, global influences, data-driven computer models, and the ease of analyzing and investing in a great number of investment choices.
It is time to rethink the efficient frontier to accommodate new investment approaches to achieve reduced risk and improved returns. Today’s investment managers have the ability to go beyond simplistic formulas to create financial security for their clients by using investment approaches that take advantage of the enormous potential and flexibility of the financial markets.
By developing allocations based on market conditions and incorporating the use of strategic diversification, today’s active managers can manage risk while dynamically optimizing portfolio allocations. This is where a total portfolio approach to active management comes into play.
Exhibits developed by Flexible Plan Investments Ltd. research group. Figure 2 is an original concept developed by Rydex/SGI (now a part of Guggenheim Investments). Equity returns are based on the S&P 500 Index, including the reinvestment of dividends. Bond returns include the reinvestment of dividends and are based on the Barclays Capital Aggregate Bond Index. Index returns do not reflect any management fees, transaction costs, or expenses.
The opinions expressed in this article are those of the author and do not necessarily represent the views of Proactive Advisor Magazine. These opinions are presented for educational purposes only.
This article first published in Proactive Advisor Magazine on May 14, 2015, Volume 6, Issue 7.
 Linda Ferentchak is the president of Financial Communications Associates. Ms. Ferentchak has worked in financial industry communications since 1979 and has an extensive background in investment and money-management philosophies and strategies. She is a member of the Business Marketing Association and holds the APR accreditation from the Public Relations Society of America. Her work has received numerous awards, including the American Marketing Association’s Gold Peak award. activemanagersresource.com
