

Editor’s note: Despite the rapid-fire action emanating from the Oval Office last week, markets seemed to take it all relatively in stride, with the Dow Jones reaching the long-anticipated 20,000 milestone, the SPX rising 1%, and the NASDAQ Composite putting in an impressive 1.9% gain.
Barron’s cover story this past weekend said, “The Dow hitting 20,000 was no fluke. Today’s stock prices are well supported by corporate earnings and economic growth. In fact, if President Trump can avoid stumbling into a trade war—or a real war—the Dow could surpass 30,000 by the year 2025.”
However, this week’s early market action would seem to have indicated some displeasure with the news coming out of Washington and uncertainty over the administration’s intentions—not to mention how they are being communicated and their ultimate effect.
What is going on “under the hood” of the recent gains? And what technical indicators might foretell a shift in market momentum?
Many thanks to John Kosar, chief market strategist at Asbury Research, for allowing us to share some of his analysis. The following is from Mr. Kosar’s “Weekly Wrap-Up,” published on January 27, and his “Keys to the Week,” published on January 30.
Our quantitative model for the U.S. stock market, which uses the S&P 500 (SPX) as a proxy, shifted to Positive (“in the market”) on the open on November 9 from Neutral (“out of the market”) on November 1. This week, our table shifts to a slightly positive distribution of key near-term factors for the U.S. stock market and away from the negative one of the previous two weeks. It also moves back to the positive alignment of intermediate-term factors that had been in place since summer 2016.
From a near-term standpoint, the benchmark S&P 500’s positive one-month rate of change (ROC) amid positive ETF asset flows and narrowing corporate bond spreads is bullish heading into this week. However, this near-term bullish environment will only remain intact as long as investors stay as complacent (fearless) as they have been since the November election and, as of this morning (1/30/17), immigration-related issues over the weekend have spooked the market. Specifically, if the VIX rises and remains above 12.21 this week while high-yield corporate bond spreads rise and remain above 404 basis points, this will indicate that the 3% to 7% correction we have been warning of is getting underway.
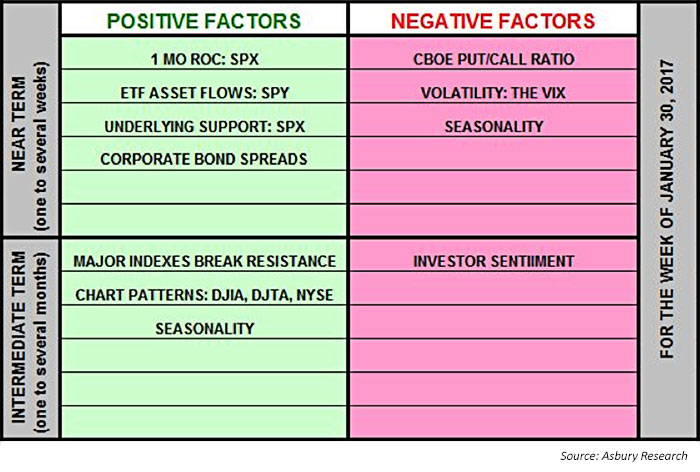
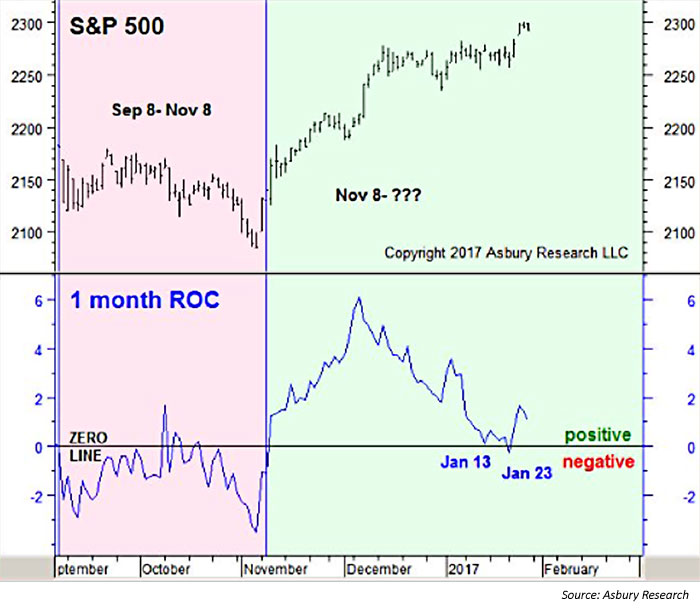
Figure 1 below shows that the S&P 500’s (SPX) one-month rate-of-change (MROC) remains positive as of November 8, indicating bullish near-term trend momentum, and begins this week rebounding from January 13 and 23 tests of its zero line from above. As long as SPX remains above the 2,250 area this week, the currently positive MROC will remain intact.
It would take a sustained decline by the MROC below its zero line, which would require a sustained move below SPX 2,234, to indicate a negative (bearish) change in the near-term trend. The red highlighted areas show this most recently occurred between September 8 and November 8. Until then, however, the post-election advance should remain intact.
 John Kosar, CMT, is chief market strategist and director of research at Asbury Research, which provides institutional research services. Mr. Kosar has more than 30 years of experience analyzing and forecasting global financial markets, having worked as a trader and analyst for several leading Wall Street firms. He is a past member of the board of directors of the Market Technician’s Association (now the CMT Association), is a featured speaker at many financial conferences, and is frequently quoted in the financial press. asburyresearch.com