
The value of ‘under the hood’ macro analysis

How comprehensive technical analysis can inform active management.
About five months ago I was invited to speak at the National Association of Active Investment Managers (NAAIM) 2015 National Conference, “Uncommon Knowledge.” My firm, Asbury Research, provides top-down, macro technical/quantitative investment research on primarily U.S. financial assets to professional investors, portfolio managers, hedge funds, and financial advisors.
My purpose was to give a topline review of some of the tools and metrics that my firm tracks every day for clients. My goal was to show that through utilizing a broad, diverse list of different metrics, one could construct a comprehensive and accurate assessment of current market conditions, identifying potential warning signals or, conversely, positive indicators. This was based on what was really going on “under the hood” of the market at that specific time, rather than projections for economic or fundamental performance at some point in the future.
Don’t get me wrong—economic conditions and fundamental factors ultimately dictate the value of an asset, taking it from Point A to B. But how it gets there is often the difference between making and losing money in the market. Investors and fund managers can benefit by having the “other side of the elephant” revealed, the part they may not be readily seeing.
We believe the market itself is the ultimate clearinghouse for the collective wisdom of all of its participants, and is the most sensitive evaluator of all known and unknown market factors that can affect a portfolio. The total market picture is derived from looking at all sides, and is a valuable input in identifying opportunity and risk.
May 2015 market situation
In May 2015, I still had upside targets between 3% and 7% above the market in the market-leading NASDAQ 100 and Russell 2000, but I also saw potential problems in the NASDAQ 100’s cousin, the NASDAQ Composite. This broader index was struggling to rise above its top-of-the-tech-bubble high, while the Dow Transports were also showing relative weakness.
These factors, plus the market color added via a number of additional metrics, told me that the 2015 market advance was probably in the 7th or 8th inning, and that it would soon be time to play defense. Although my upside target for the NASDAQ 100 was met in late July, the corresponding target in the Russell 2000 was never met and by the middle of August, the broad market slowly rolled into the correction we were expecting.
While it is impossible to forecast what the market is going to do next with 100% accuracy, and especially what new geopolitical risks might come into play (as China did this summer), the metrics that we track often allow investors to be prepared for changes in market direction before they happen, and often to get in front of them before the occur.
Key metrics and why they are important
Here is a very topline look at some of the metrics we typically look at and were reviewed at the conference:
Price, Trend, Support, and Resistance levels for major indexes, including international markets: Price is the “pay-to-play” voting booth for financial assets, and doesn’t lie. Price patterns that indicate investor fear and greed can indicate opportunity and limit risk.
Interest rates as seen in the behavior of the benchmark 10‐Year Treasury Note and in the yield curve: The stock market trades from news item to news item and can be particularly confusing due to influences like high frequency trading. The bond market, however, tends to be more “sober” and focused on the quarter rather than the day.
U.S. dollar/commodity prices: Commodity prices, and their relationships, can say a lot about the strength or weakness in the global economy.
Leadership, or lack thereof, of key individual bellwether stocks: Many large-cap stocks, like Berkshire Hathaway and Cisco Systems, have maintained over time a stable positive correlation to their broader indexes, and thus can be used as a bellwether for upcoming market direction.
Technical indicators, such as MACD, Market Breadth, and Overbought/Oversold: These metrics can help to better define trend, price momentum, and instances when price has moved too far, too fast, and is vulnerable to a reversal.
Investor asset flows: Asset flows are one of the only metrics that lead price. Asbury tracks weekly commercial hedging activity to determine both positioning and level of conviction in physical assets, be it the stock market, bonds, or commodities. We also track daily asset flows in about 30 different financial assets, and have built our own metric to determine emerging opportunities in sector rotation.
Volatility indicators, including the VIX and options trading: Knowing when investors are collectively fearful or complacent helps to identify periods when one should be invested, and when to be cautious and defensive.
Intermarket analysis between U.S. and key foreign markets such as Japan, Germany, and UK: Over the years we have built and maintained a large database of global intermarket correlations.
Seasonality and Sentiment: We track a dozen or so different survey- and asset flow–based investor sentiment metrics. Knowing what investors are thinking, and how they are positioned in certain financial assets, can tell us a lot about where financial asset prices are probably headed over the next several months.
Real-time examples
While my presentation covered chart analysis in all of the areas above, let’s focus on three indications that were troubling back in May:
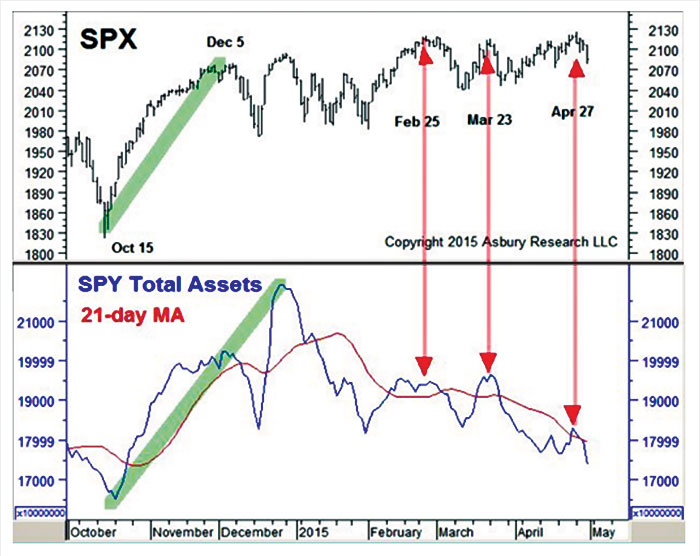
Investor Asset Flows. The total net assets in the S&P 500 SPDR (SPY) were contracting over several months, even though the S&P 500 was setting slightly higher new highs. This indicated that near-term bullish conviction was waning, and was a definite danger signal (Exhibit 1).
EXHIBIT 1: SPX PRICE PERFORMANCE AND SPY ASSET FLOWS, OCT. ‘14-MAY ‘15
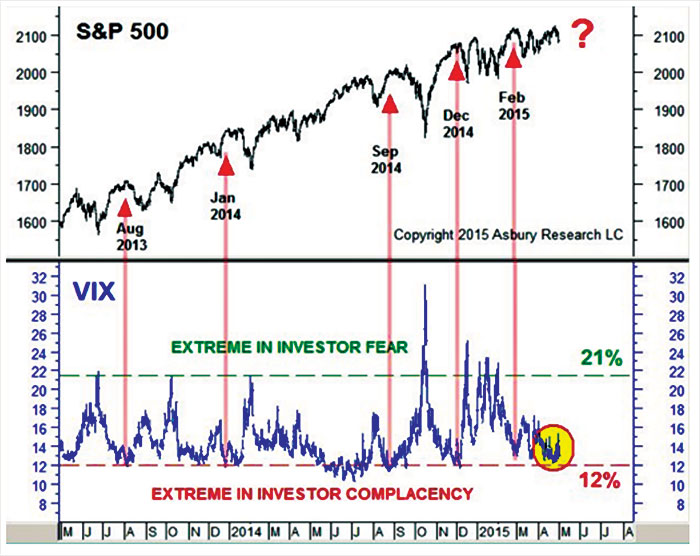
Volatility. At the time of the presentation, the VIX was hovering near 12.0, indicating a complacent extreme that has historically been a coincident or leading indicator of an upcoming U.S. broad market decline. The S&P 500 peaked roughly two weeks later, eventually declining 12.6% from peak to the low of the year at the end of August (Exhibit 2).
EXHIBIT 2: S&P 500 VS. VIX VOLATILITY INDEX, MAY ‘13-MAY ‘15
Intermarket Analysis. The Japanese Nikkei 225 Index, which is positively correlated to the S&P 500, was testing major resistance at its 20,833 April 2000 high (finally trading as high as 20,953), but subsequently collapsed by 19% into the August 24 lows. The index’s struggle at 20,833 was an indirect warning signal of a coincident decline perhaps to come in the U.S. markets.
Where are the markets now?
Shifting to the present, since mid-September our work has been suggesting that the U.S. stock market has been in the process of establishing an intermediate-term bottom that should precede a steady rise into year end. The case for this has been further supported over just the past several weeks by a strong rebound in Japanese and European stocks which suggests, at least thus far, there has been no significant global contagion resulting from weakness in China. We are monitoring China’s situation closely and any signs of a rapid spread of global deflation in other regions. We continue to watch all global stock indexes and influential commodity prices such as copper and crude oil. As long as key fear gauges here in the U.S., like the VIX and corporate bond spreads, remain benign, we expect a retest of 2015 stock market highs before the end of the year.
The tools and metrics that we use in our analysis are not quantum physics, but rather a fairly broad array of readily available data series, some which we have modified to be more effective in predictive power. The strength of our analysis, and why it works, is in the sheer breadth of the many metrics that we use and, most important, their interpretation into a comprehensive strategy. This fits well with the objectives of many active investment managers, providing an additional global macro view to the quantitative analysis and models they employ in their own portfolio approaches.
 John Kosar, CMT, is chief market strategist and director of research at Asbury Research, which provides institutional research services. Mr. Kosar has more than 30 years of experience analyzing and forecasting global financial markets, having worked as a trader and analyst for several leading Wall Street firms. He is a past member of the board of directors of the Market Technician’s Association (now the CMT Association), is a featured speaker at many financial conferences, and is frequently quoted in the financial press. asburyresearch.com