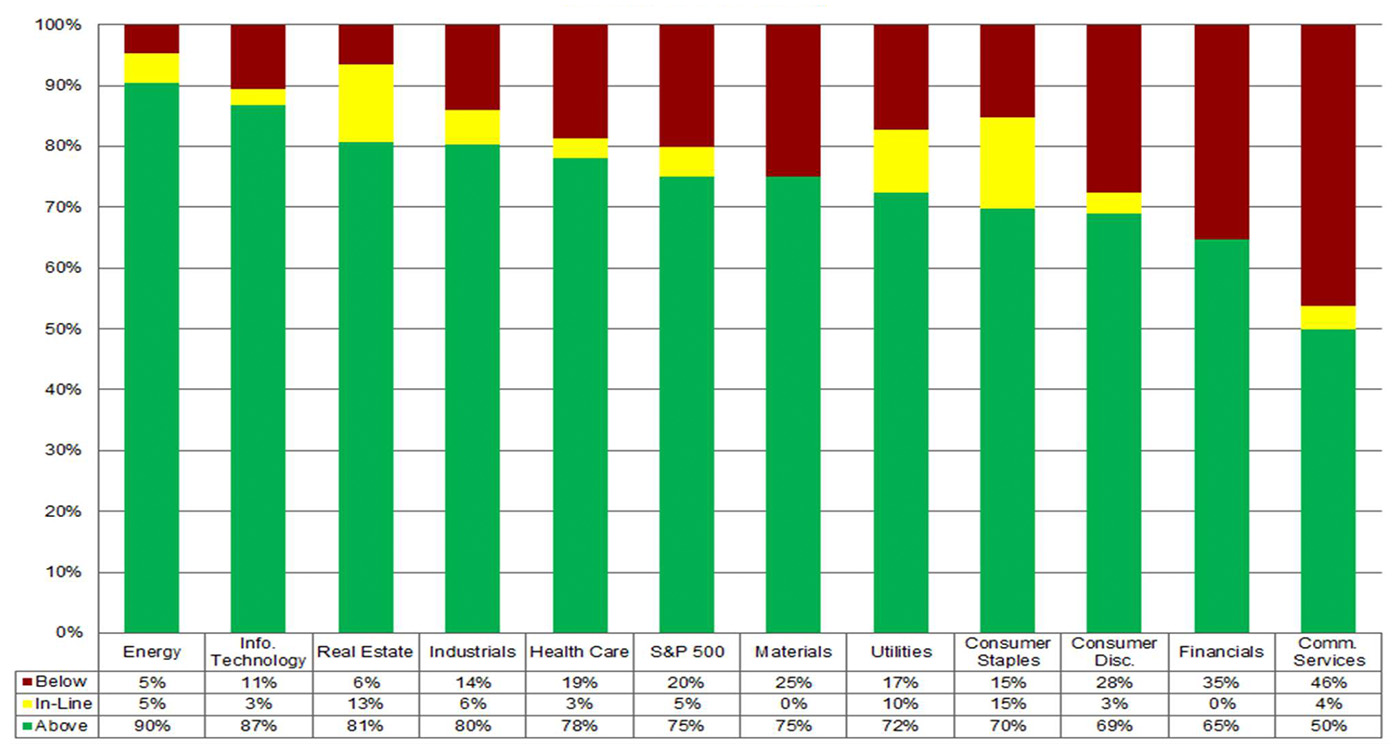
With the Q2 2022 earnings season complete for S&P 500 companies, data and analytics firm FactSet recently provided a summary of major highlights, which included the following:
-
Overall, the S&P 500 companies reported Q2 earnings growth just above 6%. While this was the lowest growth rate since Q4 2020, it was significantly higher than estimates for 4% growth in July.
-
Revenues for S&P 500 companies are projected to have grown at a 14% rate, surpassing estimates for 10% revenue growth in July.
-
76% of S&P 500 companies’ actual earnings surpassed earnings estimates, about par with the past five-year average. 70% of companies reported a positive revenue surprise.
-
The Energy sector’s earnings growth for Q2 is now reported at 293%, well above the next-highest sector, Industrials, at a 27% growth rate.
-
The topic of inflation was top of mind for many companies on earnings calls, with over 400 companies mentioning it at least once.
FIGURE 1: S&P 500 EARNINGS ABOVE, IN-LINE, BELOW ESTIMATES (Q2 2022)

Source: FactSet
FactSet’s Q3 earnings outlook
FactSet recently provided the following detailed metrics and estimates for the Q3 2022 earnings season as of Sept. 9, 2022:
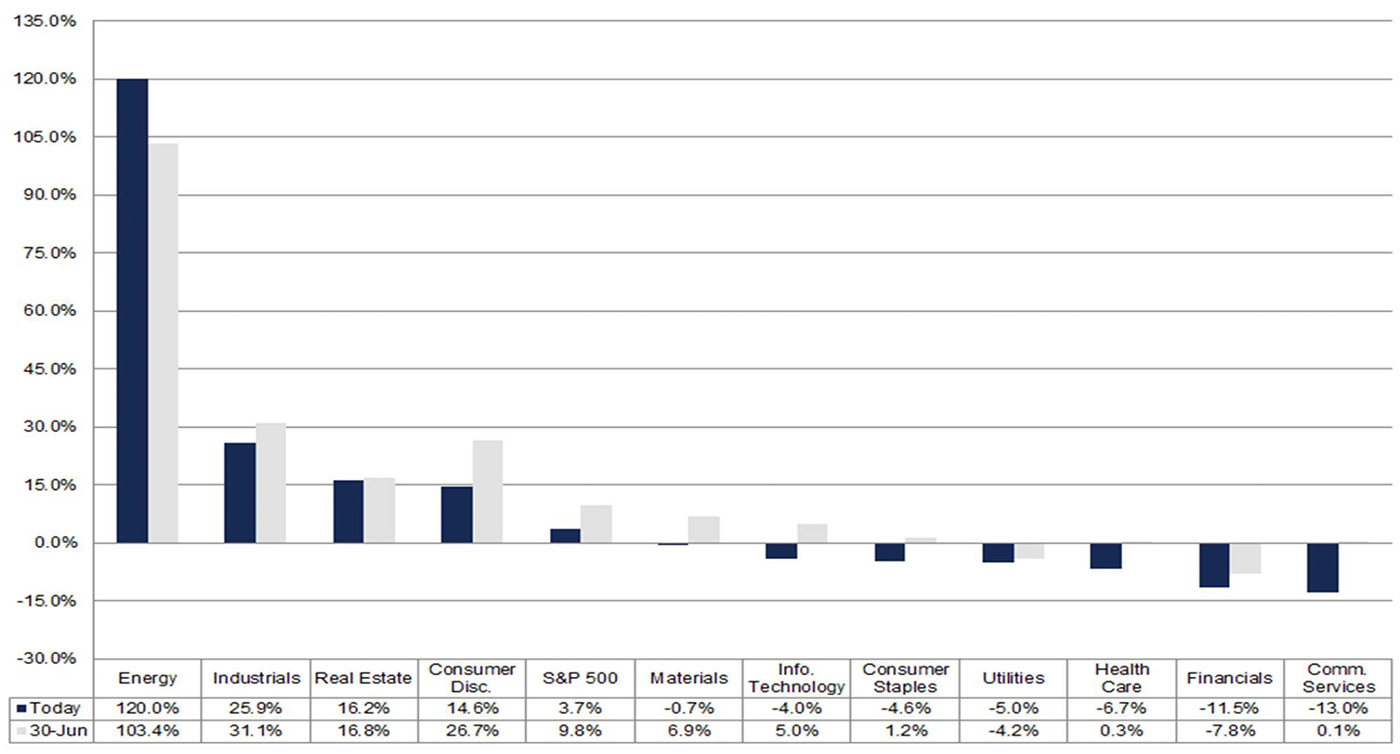
- “Earnings Growth: For Q3 2022, the estimated earnings growth rate for the S&P 500 is 3.7%. If 3.7% is the actual growth rate for the quarter, it will mark the lowest earnings growth rate reported by the index since Q3 2020 (-5.7%).”
- “Earnings Revisions: On June 30, the estimated earnings growth rate for Q3 2022 was 9.8%. Ten sectors are expected to report lower earnings today (compared to June 30) due to downward revisions to EPS estimates.”
- “Earnings Guidance: For Q3 2022, 63 S&P 500 companies have issued negative EPS guidance and 40 S&P 500 companies have issued positive EPS guidance.”
- “Valuation: The forward 12-month P/E ratio for the S&P 500 is 16.8. This P/E ratio is below the 5-year average (18.6) and below the 10-year average (17.0).”
FIGURE 2: S&P 500 ESTIMATED EARNINGS GROWTH (Q3 2022)

Source: FactSet
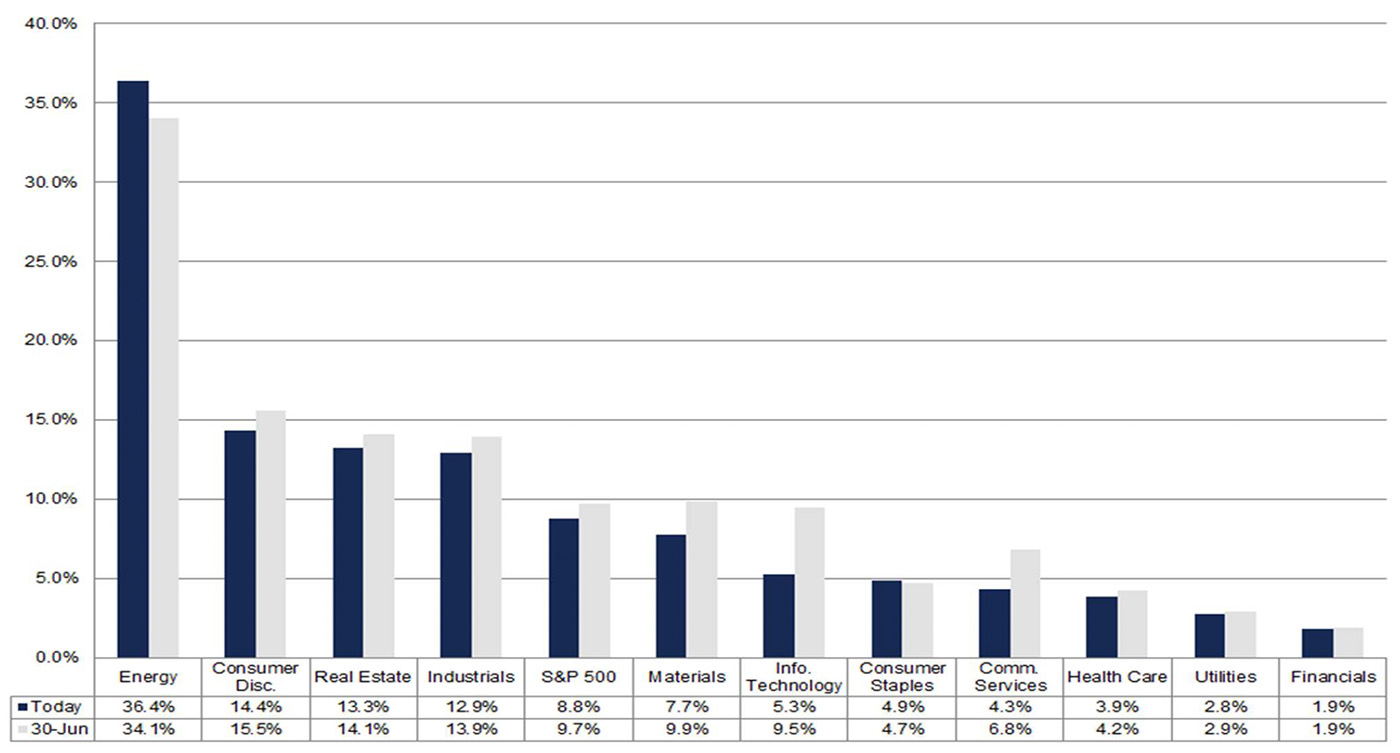
FIGURE 3: S&P 500 ESTIMATED REVENUE GROWTH (Q3 2022)

Source: FactSet
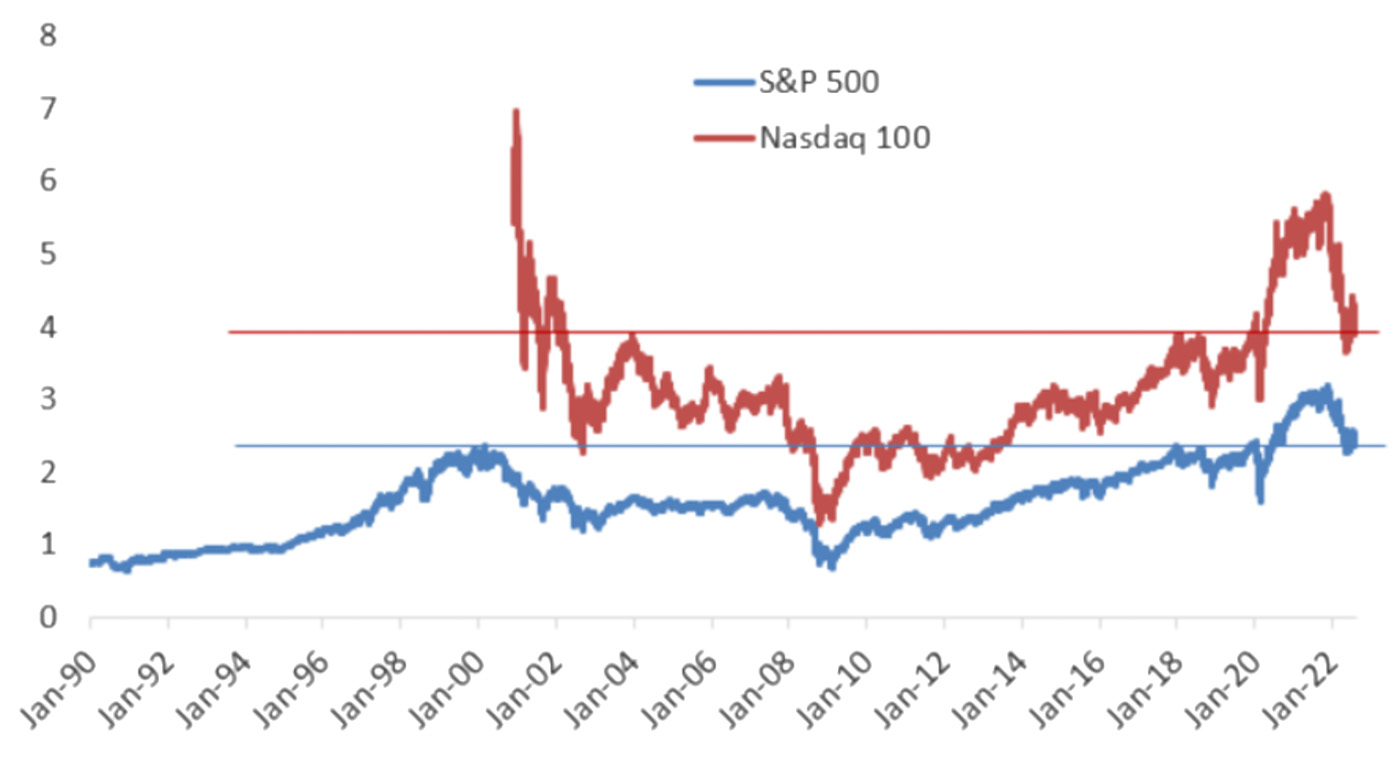
Related to S&P 500 revenue-growth projections, Bespoke Investment Group took a recent look at the price-to-sales ratios for the S&P 500 and NASDAQ 100 (Figure 4), noting the following:
“Both have come down dramatically, but they’re also still quite elevated. Both indices have seen price-to-sales ratios come back down to pre-COVID highs, but even that level was high relative to levels seen throughout the mid-2000s and 2010s.”
FIGURE 4: PRICE-TO-SALES RATIOS FOR THE S&P 500 AND NASDAQ 100

Source: Bespoke Investment Group
New this week:
