It should not be a surprise to anyone that Q1 2020 earnings showed both a sharp decline versus year-ago results, or their absolute lower level on an EPS basis. And it also will not be a surprise when Q2 earnings are very poor for the S&P 500, with the full force of a shuttered economy hitting in April and May, and, to hopefully a lesser degree, June.
Barron’s wrote this past weekend,
“The good news is that the bad news about the U.S. economy can’t get any worse.
“With much of the country shut down during April, retail sales suffered their biggest decline on record, some 16.4%; producer and consumer prices plunged; and industrial production slid, all of which was consistent with the month’s previously reported record rise in unemployment.”
According to FactSet, with 90% of S&P 500 companies reporting as of last week, the blended earnings growth rate was -13.8%.
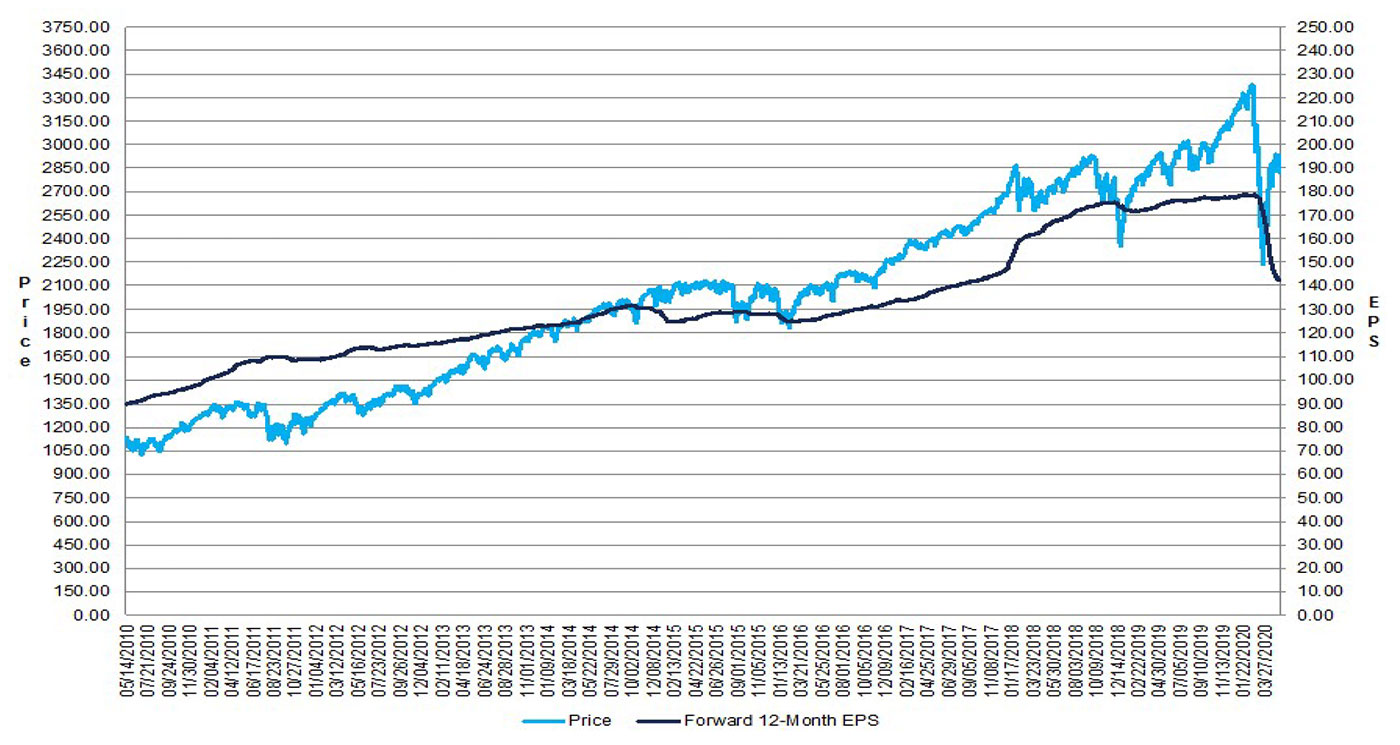
FIGURE 1: S&P 500 CHANGE IN FORWARD 12-MONTH EPS VS. PRICE CHANGE

Source: FactSet, data as of 5/15/2020
FactSet provided the following key findings on May 13 for the Q1 2020 earnings season:
- “Earnings Scorecard: For Q1 2020 (with 90% of the companies in the S&P 500 reporting actual results), 65% of S&P 500 companies have reported a positive EPS surprise and 57% of S&P 500 companies have reported a positive revenue surprise.
- Earnings Growth: For Q1 2020, the blended earnings decline for the S&P 500 is -13.8%. If -13.8% is the actual decline for the quarter, it will mark the largest year-over-year decline in earnings reported by the index since Q3 2009 (-15.7%).
- Earnings Revisions: On March 31, the estimated earnings decline for Q1 2020 was -6.9%. Four sectors have lower growth rates today (compared to March 31) due to downward revisions to EPS estimates and negative EPS surprises.
- Earnings Guidance: For Q2 2020, 18 S&P 500 companies have issued negative EPS guidance and 17 S&P 500 companies have issued positive EPS guidance.
- Valuation: The forward 12-month P/E ratio for the S&P 500 is 20.3. This P/E ratio is above the 5-year average (16.7) and above the 10-year average (15.1).”
Despite the overall weak earnings results for Q1, there were several bright spots—along with some truly disastrous reports.
On a sector basis for Q1, Zacks Research noted,
- “Tech sector profitability has held up a lot better compared to other sectors, with Q1 earnings and revenues for the Tech companies that have reported up +6.2% and +5.4% from the year-earlier levels, respectively. An above-average proportion of Tech companies have beaten Q1 EPS and revenue estimates.
- For the Consumer Staples companies (94.4% of the sector’s market cap in the S&P 500 companies has reported), total Q1 earnings are up +7.3% on +4.9% higher revenues, with 78.6% beating EPS estimates and 64.3% beating revenue estimates. Other sectors with positive earnings growth in Q1 include Medical (+10.3%), Construction (+27.8%), Utilities (+5.7%) and Business Services (+9%).
- Bigger than expected credit costs to account for the economic downturn have weighed heavily on the Finance sector’s profitability, which is dragging down the overall Q1 earnings growth pace for the S&P 500 index. For the Finance sector, total earnings are down -32.5% from the same period last year on +2.4% higher revenues, with only 55.8% of the sector companies beating EPS estimates and 60.0% beating revenue estimates.
- Q1 earnings are expected to be below the year-earlier level for 10 of the 16 Zacks sectors, with double-digit declines at Autos (-76.7% earnings decline), Aerospace (-33.5%), Energy (-25.2%), Basic Materials (-32.0%), Transportation (-61.6%), Industrial Products (-19.4%), Conglomerates (-15.6%), Consumer Discretionary (-31.8%), Finance (-33.1%), and Retail (-21.0%).”
Looking forward, Zacks sees the following scenario for the next two quarters, and 2020 overall:
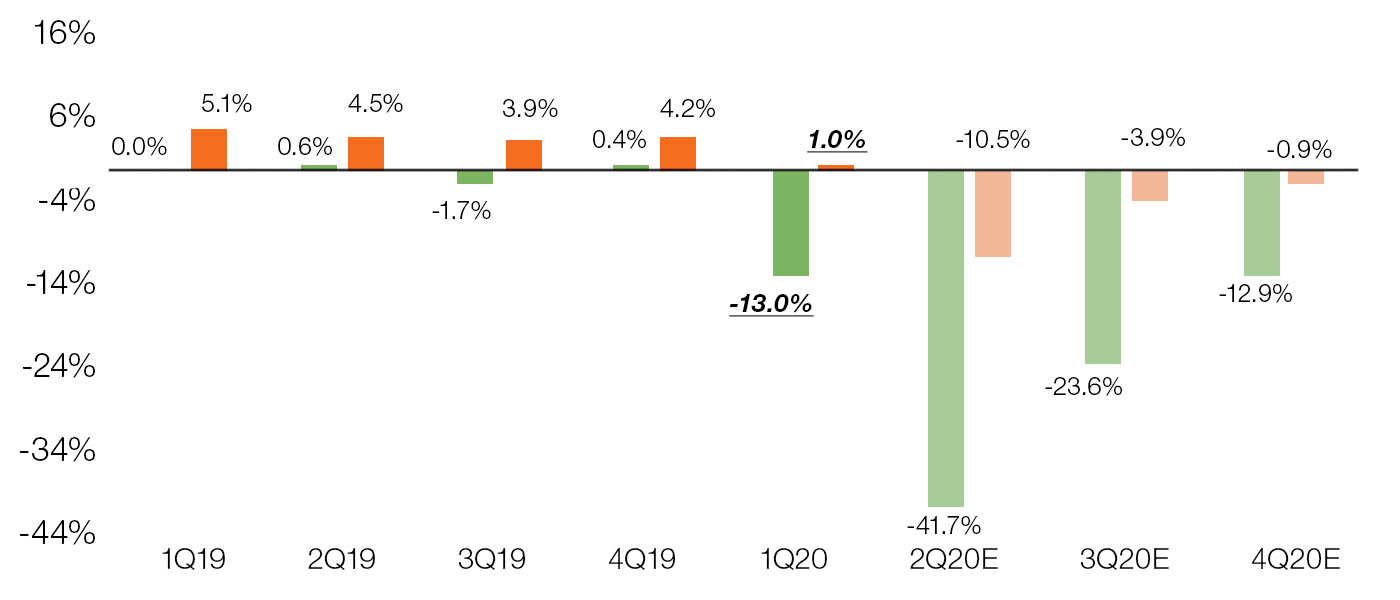
- “Estimates for Q2 and Q3 are still falling, with Q2 earnings now expected to decline -41.7% and Q3 expected to suffer a -23.6% decline.
- Sectors suffering the brunt of estimate cuts in Q2 include Energy (-142.2% decline in earnings), Autos (-213.5%), Transportation (-153.2%), Aerospace (-57.6%). Other sectors with big year-over-year earnings declines include: Consumer Discretionary (-80.4%), Basic Materials (-58.4%), Industrial Products (-53.5%), and Conglomerates (-73.2%).
- For full-year 2020, total earnings for the S&P 500 index are currently expected to be down -22.9% on -5.5% lower revenues. This is down from close to +8% growth expected at the start of the year. For reference, S&P 500 earnings declined -19.1% in 2008 and -3.4% in 2009, though that was admittedly a different type of downturn.”
Figure 2, from Zacks, presents expectations for 2020 “in the context of what was actually reported in the preceding periods and what is currently expected in the back half of the year.”
FIGURE 2: QUARTERLY EARNINGS & REVENUE GROWTH (YOY)

Source: Zacks Investment Research
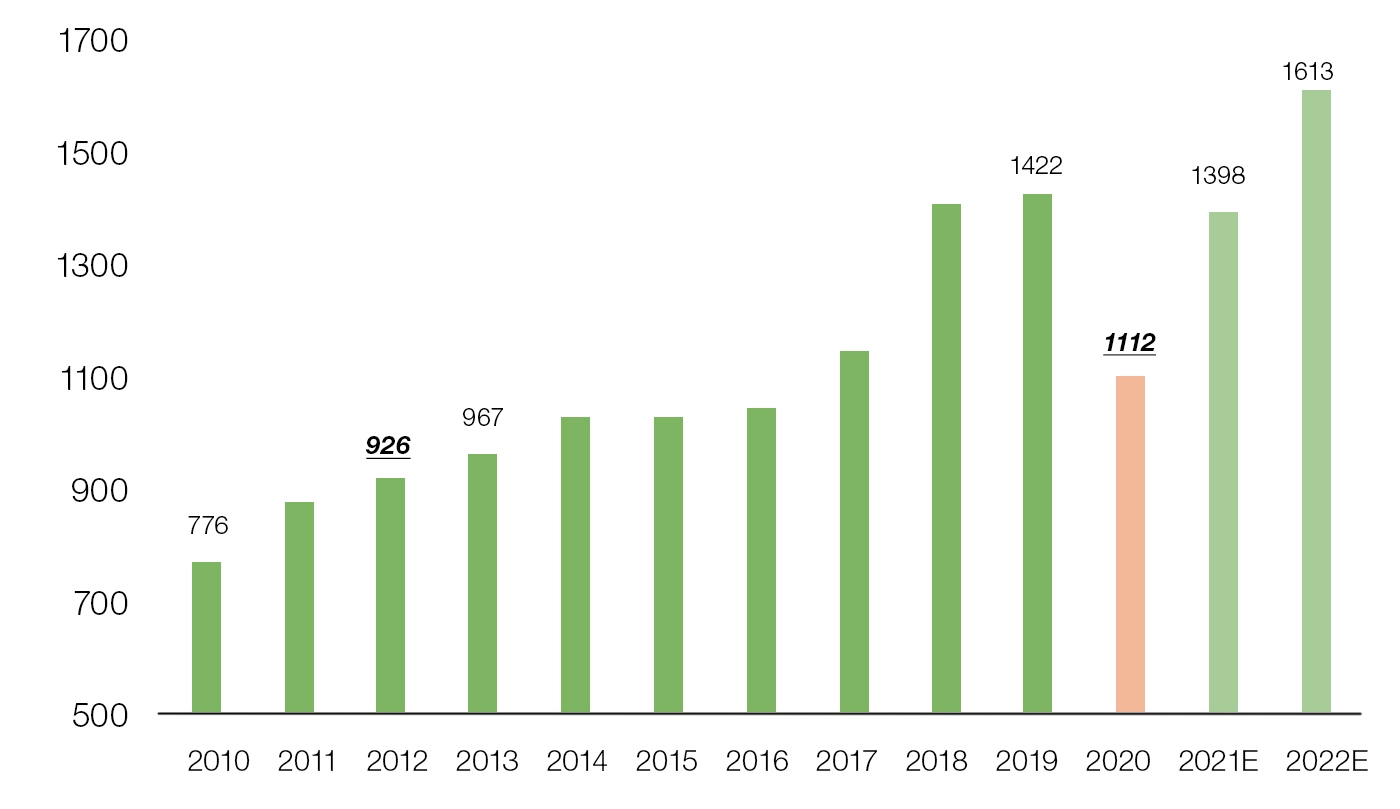
Figure 3 presents an outlook for full-year S&P 500 dollar earnings for 2020, 2021, and 2022 versus actuals for prior years.
Zacks observes, “Please note that while full-year 2021 earnings for the S&P 500 index are currently expected to be up +26.4% from the steadily lowered 2020 level, the absolute dollar amount of 2021 earnings estimates are now modestly below the 2019 level.”
FIGURE 3: TOTAL S&P 500 ANNUAL EARNINGS ($ BILLIONS)

Source: Zacks Investment Research
On a somewhat brighter note for the intermediate-term earnings outlook, an analysis at Seeking Alpha says,
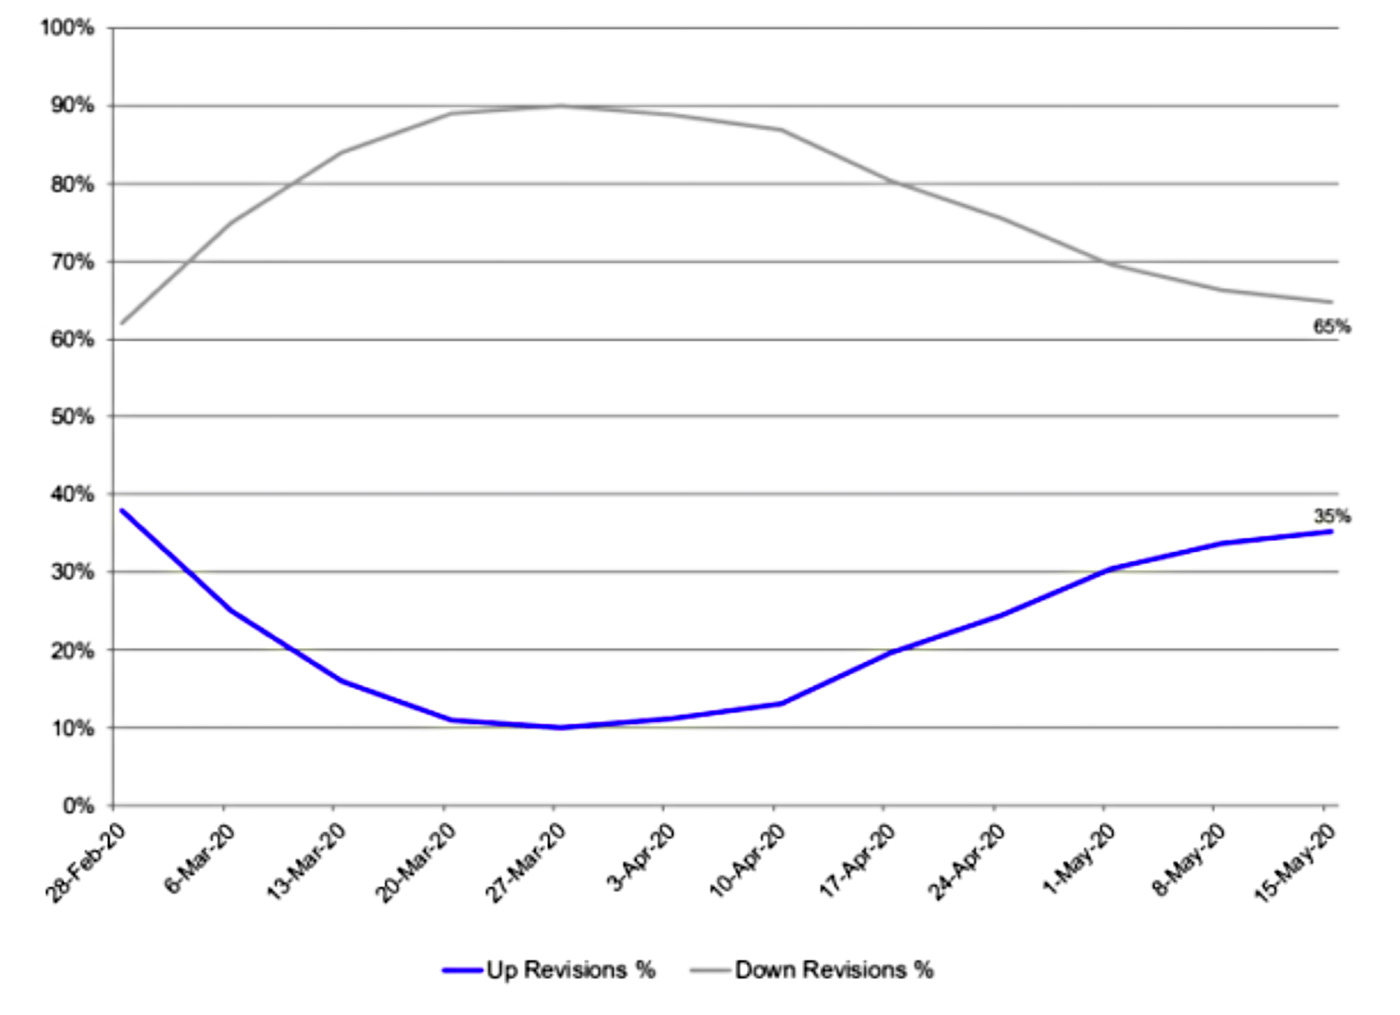
“2nd quarter metrics will likely get even worse over the next 6 weeks when Q2 ’20 financial results start being reported. … [But] no one seems to be talking about the slower rate of erosion in forward S&P 500 earnings—and maybe for good reason—since the 20% unemployment rate, the possible 30% drop in Q2 ’20 GDP, and the horror show that is the US economic data, seems to have everyone trapped in ‘Primal Fear’. …
“Tracking the ‘rate of change’ of the forward estimates seems to be a better way to navigate an uncertain environment. … S&P 500 earnings revisions are getting less negative.”
FIGURE 3: TOTAL S&P 500 ANNUAL EARNINGS ($ BILLIONS)

Sources: I/B/E/S data from Refinitiv, Seeking Alpha, trinityasset.com
