
Mapping the active strategy universe
Mapping the active strategy universe

A view into how professional strategists might classify active strategies.
When someone is first exposed to actively managed strategies, they may think they just stepped foot on another planet. They hear a new language that includes many foreign terms such as tactical asset allocation, statistical arbitrage, momentum, mean reversion, etc. The complexity can seem overwhelming when compared to the relative simplicity of passive strategies. There appear to be more flavors of active strategies than anyone could ever hope to make sense of. This article attempts to chart this world through a simple classification scheme. To do that, I will discuss actively managed strategies through the lens of four vectors: time frame, asset classes, systematic factors, and use of discretion. Through a general look at active strategy characteristics, advisors will get a glimpse into performance drivers and be able to enhance their understanding for effectively matching strategies to their clients. To start off, let’s clarify the time-frame vector. Active strategies, to give the extremes, can operate anywhere from ultra-high frequency algorithms running on servers co-located at stock exchanges to strategies that may rebalance only once a year. For the most part, strategies offered by advisors will operate on the daily time frame and longer. While active managers do react as market conditions dictate, changes in allocations are typically made far less frequently than might be expected.

Just like passive strategies, active strategies seek exposure to certain asset classes such as stocks of different size characteristics, Treasurys, investment-grade credit, high-yield credit, commodities, real estate, currency carry, volatility, or international versions of any or all of these. There are many more ways to slice the investment universe, but regardless of the particular asset classes sought, the idea is to capture the risk premiums from the exposure. In academia, this exposure is known as beta. The only difference between passive and active strategies when it comes to beta is that active strategies often attempt to capture the premiums while avoiding the risk. How? The answer leads us to the third vector of systematic factors. In academia, these are known as alpha, or performance unexplainable by exposure to asset class risk factors. And according to efficient market theory, these should not exist.
When developing an active strategy, there are basically two schools of thought. On one side are those that attempt to find some market inefficiency that becomes the basis of a truly unique strategy that holds the promise of outstanding risk-adjusted returns. Techniques such as statistical arbitrage, pattern recognition, and machine learning come from the “unique” school. Although truly unique strategies may have great potential, the creator must navigate a sea of development biases and overcome a gauntlet of formidable competition commanding armies of Ph.D.s and almost unlimited computer power. Because of these issues, performance of such strategies can be fleeting, or worse, just a mirage from data mining. Unique strategies may also have a tough time during the due-diligence process because vetting usually involves understanding the drivers of risk and return.
Active strategies are disciplined and based on well-researched market behaviors.
The other school of thought starts from a foundation of academic and practitioner research. The core tenet of the “research” school is to leverage market behaviors that are well-studied and likely to continue. In academia, these are known as anomalies. So, what are they? This, too, is a source of debate, because depending on the criteria, there may be anywhere between a handful and several hundreds. Two recent studies (Campbell, Liu, and Zhu, 2014; and Hsu and Kalesnik, 2014) make valiant attempts to uncover systematic factors identified in top-tier research using logical and stringent criteria:
- Performance has been consistent over many years and has survived numerous database revisions, as well as extensive out-of-sample data.
- The factor has been vetted, replicated, and debated in top academic journals over many years.
- The factor works across multiple asset classes.
- Minor variations in definition/construction do not significantly impact performance.
- There is a credible reason to offer a persistent edge. Either it is related to a human behavioral bias that is not likely to change, or it is related to an institutional feature that cannot be easily changed.
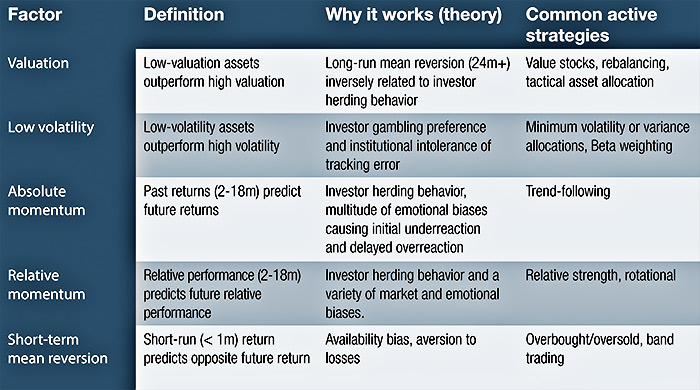
Using these criteria, they find that only the valuation, low volatility, illiquidity, and momentum factors are significant when adjusted for data snooping bias. However, because illiquid securities have very little capacity, that factor is not commonly capitalized on by professional managers. Additionally, research indicates that the momentum factor can be logically subdivided into three separate factors (absolute, relative, and mean reversion), leaving five factors that are widely used. All of these factors are summarized in the following table. An active strategy may use one or a multitude of these systematic factors. It is important to note that these are just high-level concepts. The classification does not prescribe any specific trading rules, just general tendencies. For example, one trend-following system may use moving average crossovers whereas another uses rate-of-change of returns. They are constructed differently but capitalize on the same systematic factor.
The last vector to discuss is the use of discretion, and here there is a continuum. On one end are the mechanical systems that are 100% rules-based, driven totally by programmed models. On the other end are the fully discretionary traders who use intuition and experience-based pattern recognition to make seat-of-the-pants trading decisions. Somewhere in the middle are the rules-based traders that sometimes override signals or position-sizing decisions based on conviction or extenuating circumstance. In general, the more discretion involved in a strategy, the harder it is to estimate the expected performance characteristics moving forward. In conclusion, we’ve boiled down the active strategy universe into four simple vectors: time frame, asset classes, systematic factors, and use or non-use of discretion. There are certainly other ways to classify strategies, but this method gives some insight into how professional strategists might think about the active strategy universe. Although exceptions exist, active strategies are generally disciplined and based on well-researched market behaviors. It is important for advisors to have a basic understanding of the general characteristics so they can more effectively match strategies to their clients.
The opinions expressed in this article are those of the author and do not necessarily represent the views of Proactive Advisor Magazine. These opinions are presented for educational purposes only.
 Dave Walton, MBA, was a co-founder and partner at StatisTrade LLC, a trading strategy evaluation firm that worked with fund managers and family offices to evaluate and improve trading system performance using advanced statistical techniques. Mr. Walton won the National Association of Active Investment Managers (NAAIM) 2014 Wagner Award for one of his innovative system validation methods.