
June data for the U.S. housing market showed overall weaker trends in several different categories, while home prices continued to post gains.
Existing home sales
Existing home sales fell 5.4% in June, the fifth month in a row of declines and the longest streak of declines since 2013, according to First Trust.
First Trust added the following in its economic commentary:
“Recent volatility shows that the housing market is struggling to find its footing so far in 2022, with falling affordability playing a major role. The prime culprit recently has been 30-year mortgage rates, which have already risen more than 200 basis points since December and are now hovering just below 6%, the highest level since 2008. Even more notable than the decline in sales in today’s report is that despite surging mortgage rates median prices are still climbing, posting a fifth consecutive monthly gain in June.”
FIGURE 1: U.S. TOTAL EXISTING HOME SALES (THOUSANDS)
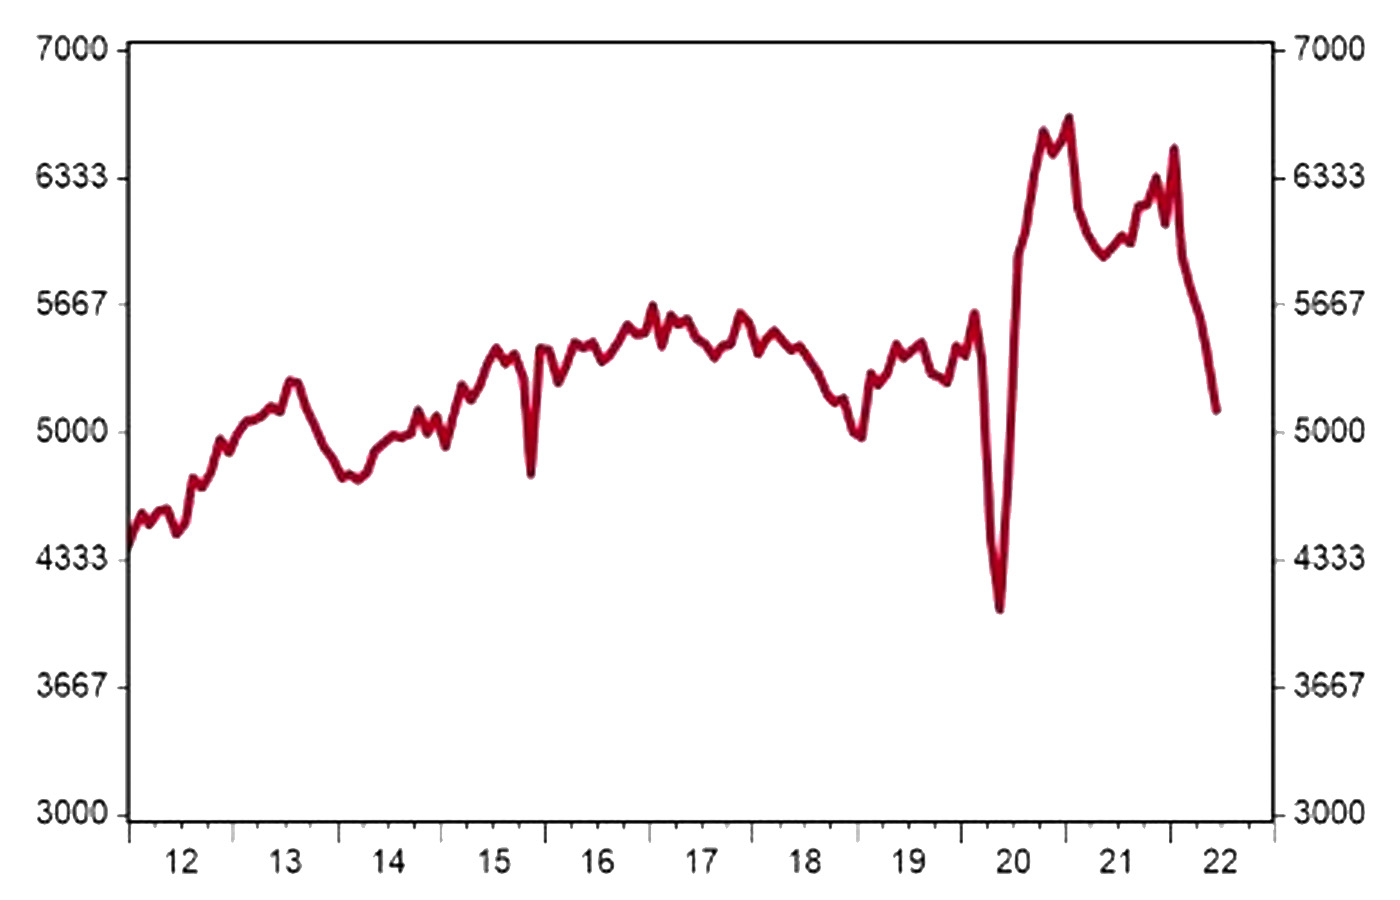
Note: Data is the seasonally adjusted annual rate.
Sources: First Trust, National Association of Realtors (NAR), Haver Analytics
Housing starts
On a similar note, overall housing starts declined 2.0% in June, although there was a divergence between single-family housing starts and multi-family housing starts.
First Trust wrote,
“Housing starts fell for a second consecutive month in June as builders continued to navigate a challenging housing market with the highest mortgage rates since 2008, labor shortages, and ongoing supply-chain issues. That said, today’s 2.0% headline decline was the result of May’s reading on construction being revised up. Without that upward revision, June housing starts would have posted a modest gain of 0.6%.
“Looking at the details, single-family construction fell 8.1% in June, driving the drop in overall starts versus the revised May level. Meanwhile, multi-unit starts rose 10.3%. It is clear developers are becoming more cautious about future demand for new single-family projects with 30-year mortgage rates hovering just below 6% and are continuing to focus resources on apartment buildings.”
FIGURE 2: SINGLE-FAMILY HOUSING STARTS VERSUS MULTI-FAMILY (THOUSANDS)
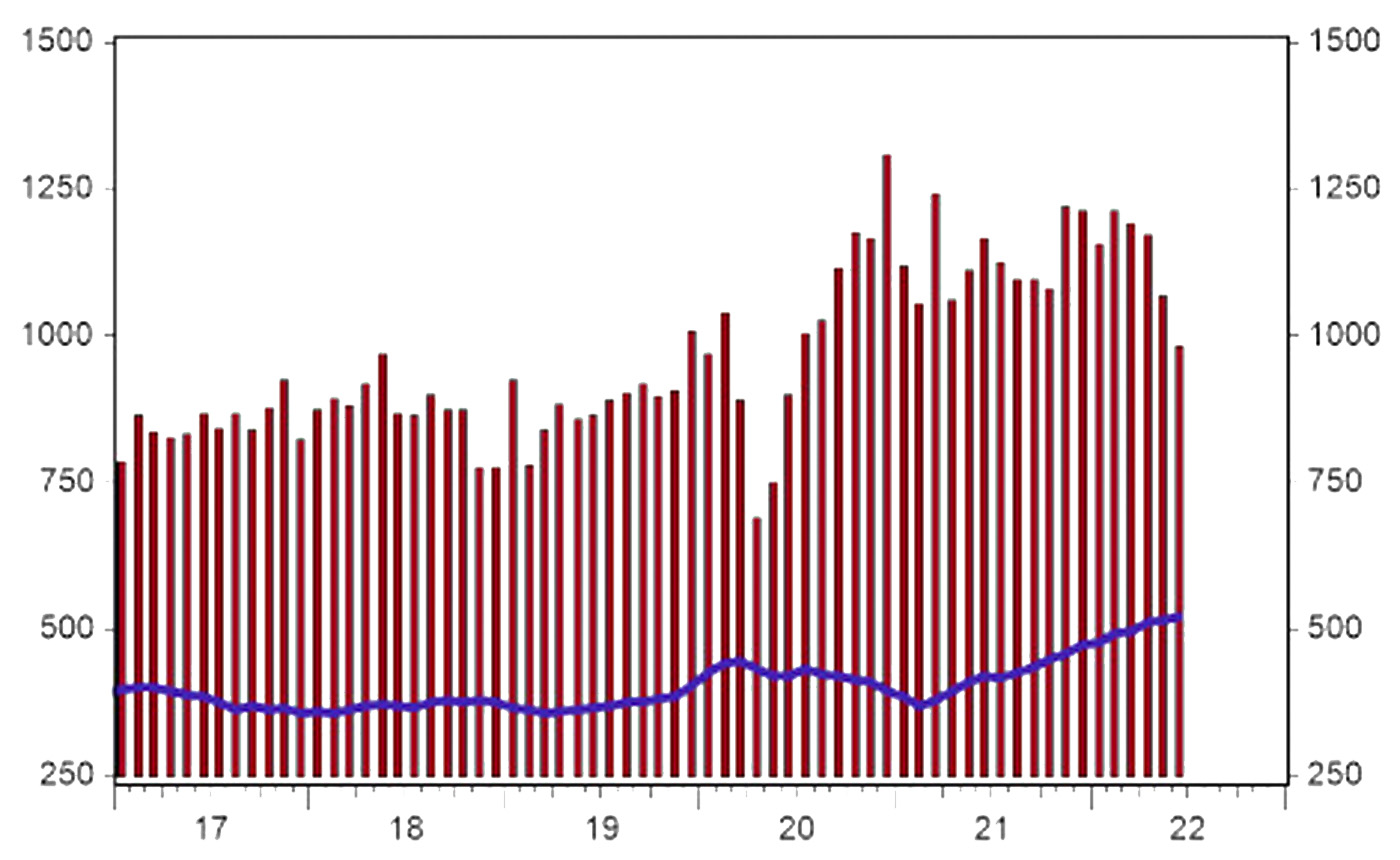
Note: Single-family starts in red; multi-family in blue, 12-month moving average. Data is the seasonally adjusted annual rate.
Sources: First Trust, Census Bureau, Haver Analytics
Homebuilder confidence
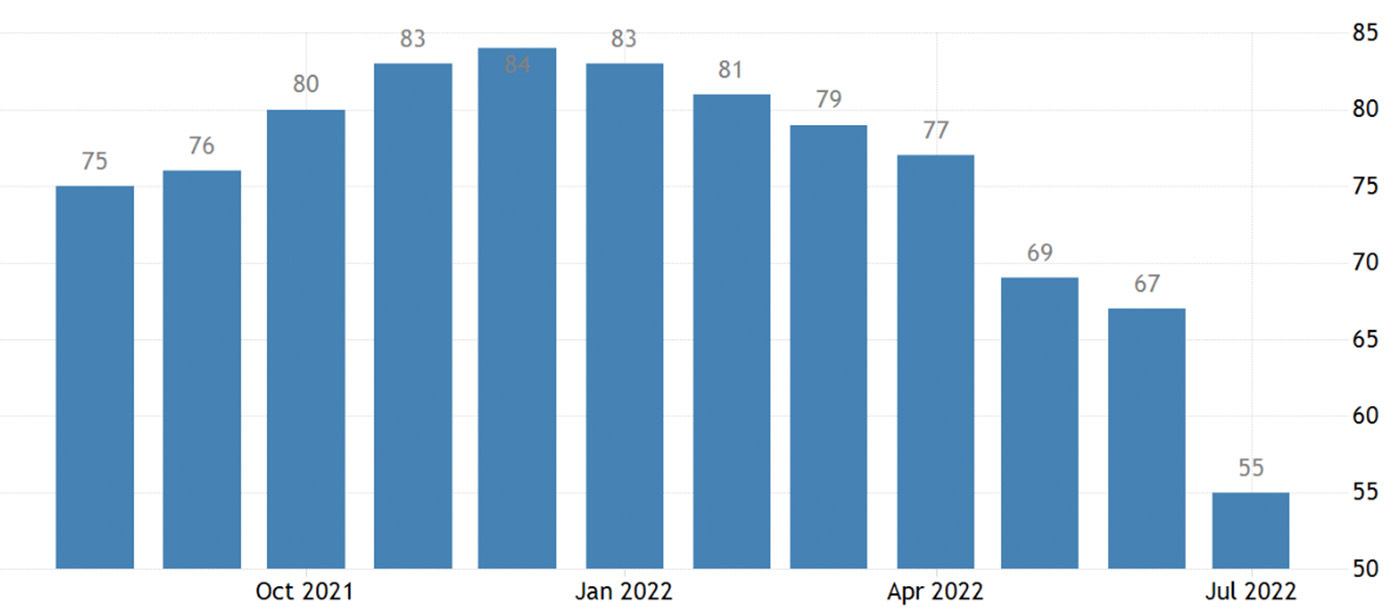
The National Association of Home Builders (NAHB)/Wells Fargo Housing Market Index (HMI) fell to 55 in July. According to Trading Economics, this was the seventh month of declines in builder confidence, the lowest reading since May 2020, and much lower than forecasts for 65. For comparison’s sake, the June confidence number was 67. This marked “the largest single-month drop in the history of the HMI, except for the 42-point drop in April 2020,” according to NAHB.
NAHB Chairman Jerry Konter said in a press release,
“Production bottlenecks, rising home building costs and high inflation are causing many builders to halt construction because the cost of land, construction and financing exceeds the market value of the home. In another sign of a softening market, 13% of builders in the HMI survey reported reducing home prices in the past month to bolster sales and/or limit cancellations.”
FIGURE 3: NAHB/WELLS FARGO HOUSING MARKET INDEX
Sources: Trading Economics, NAHB
Housing prices
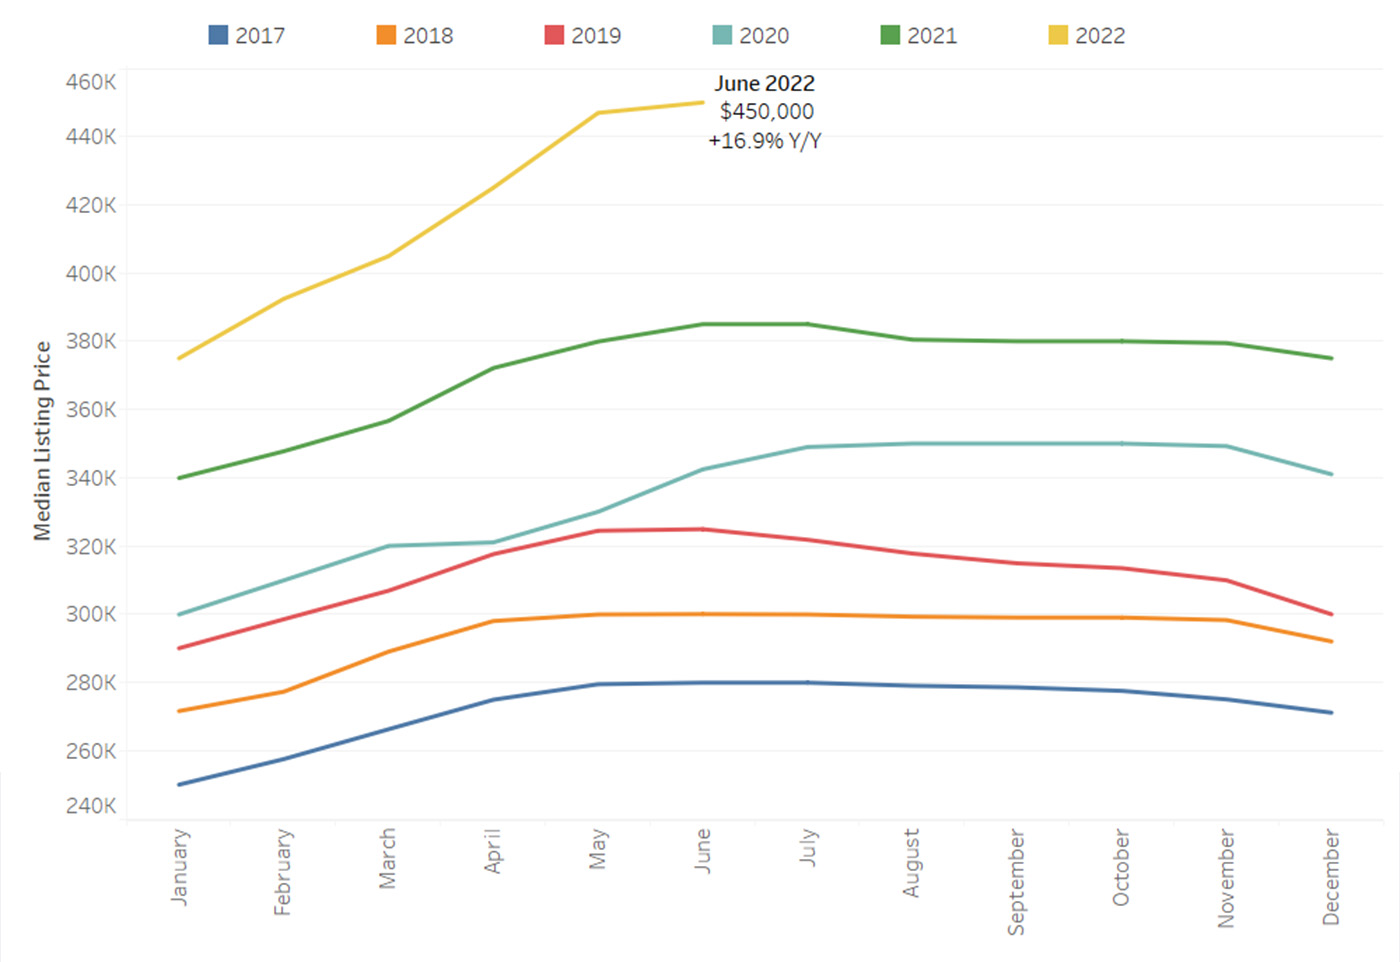
Despite the statistics cited above, according to CNBC, “The median price of an existing home sold in June set yet another record at $416,000, an increase of 13.4% year over year.” And Realtor.com reported, “The median national home price for active listings grew to a new all-time high of $450,000 in June. This represents an annual growth rate of 16.9%, a slight deceleration from last month’s growth rate of 17.6%.”
FIGURE 4: MEDIAN ACTIVE LISTING PRICE FOR U.S. HOMES
Source: Realtor.com
Implications for the economy
Bespoke Investment Group noted the following regarding implications of recent data for the economy:
“With rates rising and affordability increasingly becoming an issue, housing has already started to weaken, but this week’s data on the sector wasn’t encouraging.
- “June’s report on Building Permits and Housing Starts was more of a mixed bag with the former slightly beating forecasts while the latter slightly missed. While Housing Starts were weaker than expected, the May report was revised higher by more than the margin of the miss in June’s reading.
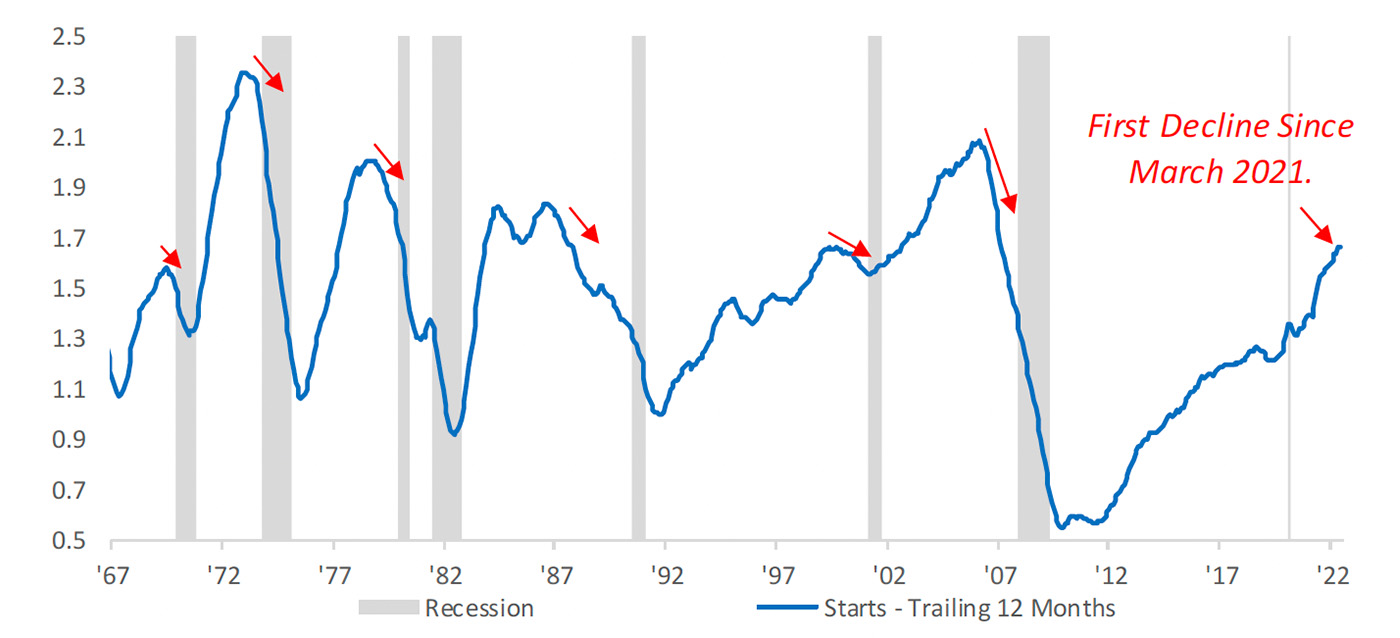
- “Housing Starts are a key metric we track in terms of gauging the health of the overall economy. The chart below shows the historical 12-month moving average of Housing Starts with recessions overlaid in gray. Before every recession since the late 1960s, Housing Starts started to roll over well in advance of upcoming recessions.
- “At this point in the cycle, we have yet to see a meaningful pullback in the moving average. However, following June’s report, the moving average saw its first m/m decline since March 2021 (even though you need a magnifying glass to see it).”
FIGURE 5: HOUSING STARTS—12-MONTH MOVING AVERAGE (1967–2022)
Source: Bespoke Investment Group
New this week:
