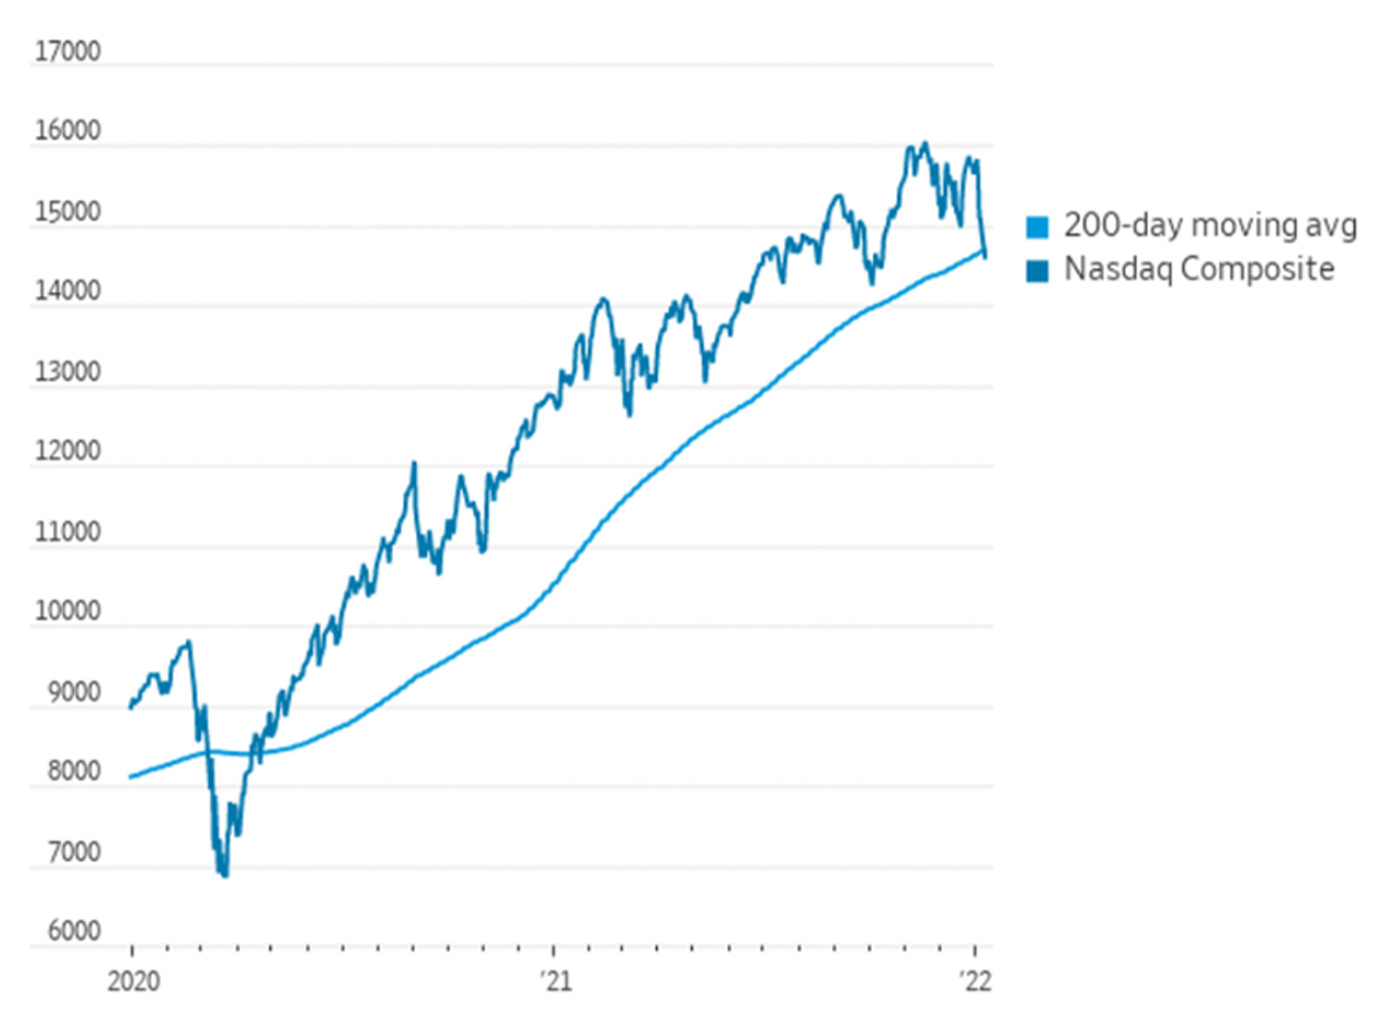
The sell-off in technology stocks was persistent last week and continued into Monday morning, Jan. 10. By the end of the trading day, the NASDAQ Composite Index had made a remarkable recovery.
Said StreetInsider.com, “After falling almost 3% earlier in the day and as much as 10.37% below its intraday record level reached on Nov. 22, the technology-heavy Nasdaq pointed sharply higher to regain all its losses for the day in afternoon trading.”
MarketWatch reported the following on the day of the first large decline:
“On Jan. 5, the Nasdaq Composite Index fell 3.5%, with declines accelerating after the release of the minutes of the Federal Open Market Committee’s meeting on Dec. 14-15. The FOMC announced on Dec. 15 that the Fed would end its net purchases of U.S. Treasury bonds and mortgage-backed securities in March. Those purchases and the expansion of the Fed’s balance sheet have been holding down long-term interest rates through the coronavirus pandemic.”
MarketWatch also noted on Jan. 10,
“The Nasdaq Composite Index was facing its fifth straight decline on Monday, which was putting the index on the verge of closing below its long-term 200-day moving average for the first time in about 20 months. … The technology laden index hasn’t closed below its 200-day MA since April 21, 2020, FactSet data show.”
As of the morning of Jan. 10, the NASDAQ Composite Index was down over 6% for 2022, with many notable tech companies seeing their stocks falling 20% or more from their own recent highs.
According to Barron’s analysis,
“The expectation of higher short-term interest rates and a reduction in the balance sheet sent the price of the 10-year Treasury note down and the yield up to as high as 1.8%. That’s a new pandemic-era high. Higher long-dated bond yields make future profits less valuable and many tech companies are valued on the expectation of sizable profits many years in the future.”

Sources: MarketWatch, FactSet, Dow Jones Market Data; chart reflects intraday trading on Jan. 10, 2022
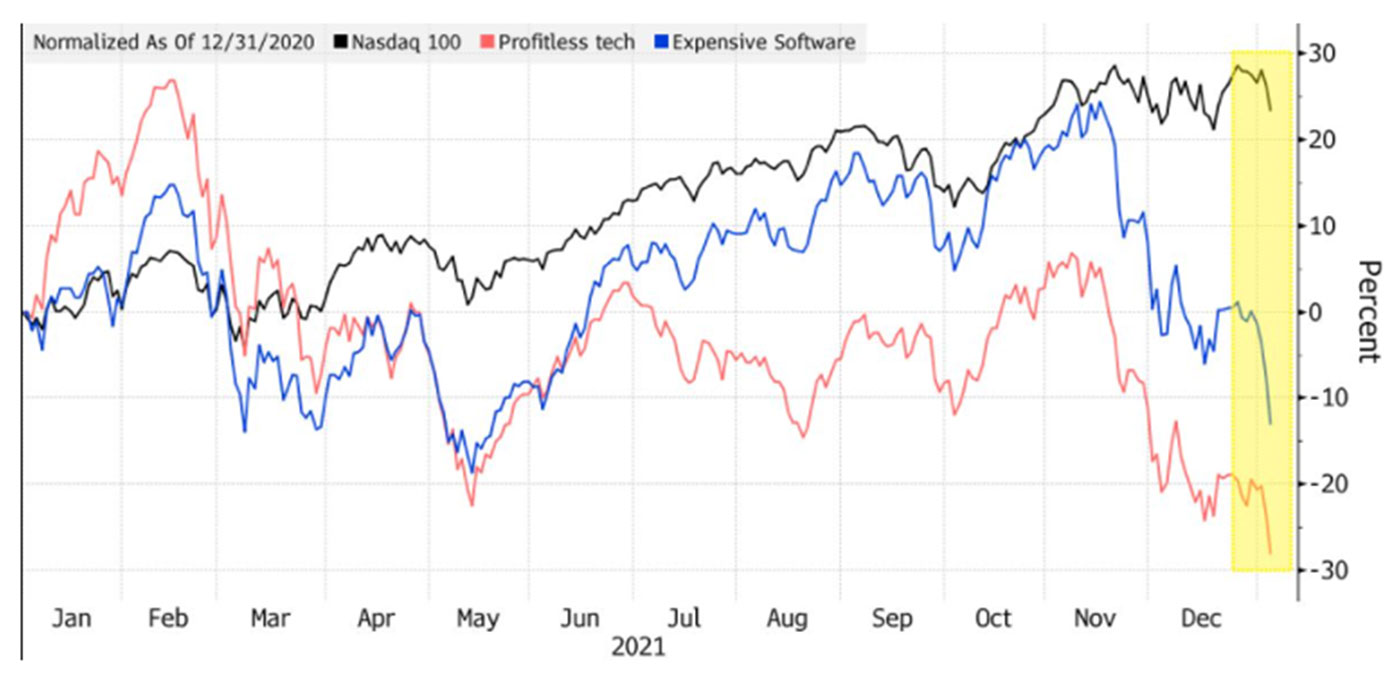
Bloomberg said last week that the tech sell-off was a continuation of a trend that had started in 2021, with the highest valuation and more speculative technology stocks leading declines:
“The hammering in technology stocks that began to spread into the broader market Wednesday is being fueled by one of the most intense bouts of selling by professional speculators since the financial crisis.
“Hedge funds, which spent December unloading high-growth, high-valuation stocks, began the new year by jettisoning software and chipmakers at a furious pace. During the four sessions through Tuesday, these sales reached the highest level in dollar terms in more than 10 years, data compiled by Goldman Sachs Group Inc.’s prime broker show.”
FIGURE 2: EXPENSIVE SOFTWARE AND PROFITLESS TECH COMPANIES LEAD DECLINE

Sources: Goldman Sachs, Bloomberg; chart data as of market close on 1/5/2022
Bespoke Investment Group notes that markets experienced “… the fifth-worst 3-day start to a year in the NASDAQ’s history. The only years with a weaker 3-day start were 2000, 2005, 2008, and 2016.”
That said, Bespoke also notes that,
“Although the fact that two of the worst years in the NASDAQ’s history were also years where the index dropped more than 3% in the first three trading days of the year, by itself, investors should not take this year’s occurrence as an overly bearish sign. Throughout the index’s history, there has been very little correlation between how it traded in the first three trading days and its rest of year return.”

Source: Bespoke Investment Group
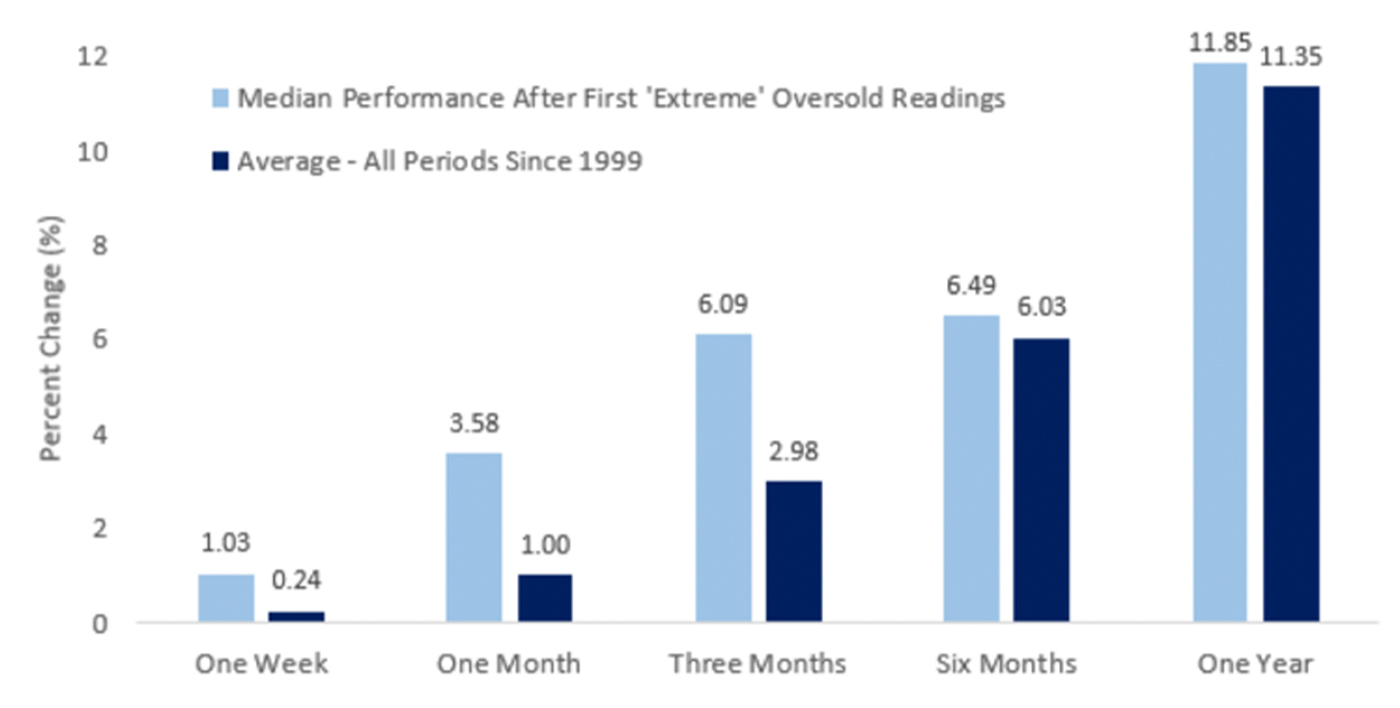
According to Bespoke, the NASDAQ 100 tracking ETF (QQQ) recently “closed more than two standard deviations below its 50-day moving average, a level we categorize as ‘extreme’ oversold, for the first time since October.”
Since 1999, those oversold occurrences have represented buying opportunities, says Bespoke.
FIGURE 3: NASDAQ 100 PERFORMANCE AFTER ‘EXTREME’ OVERSOLD READINGS (1999–2022)

Note: Performance after first “extreme” oversold reading in at least 50 trading days.
Source: Bespoke Investment Group
New this week:
