Two recent economic data points came in considerably outside of analyst forecasts, helping to fuel the equity market volatility seen in May.
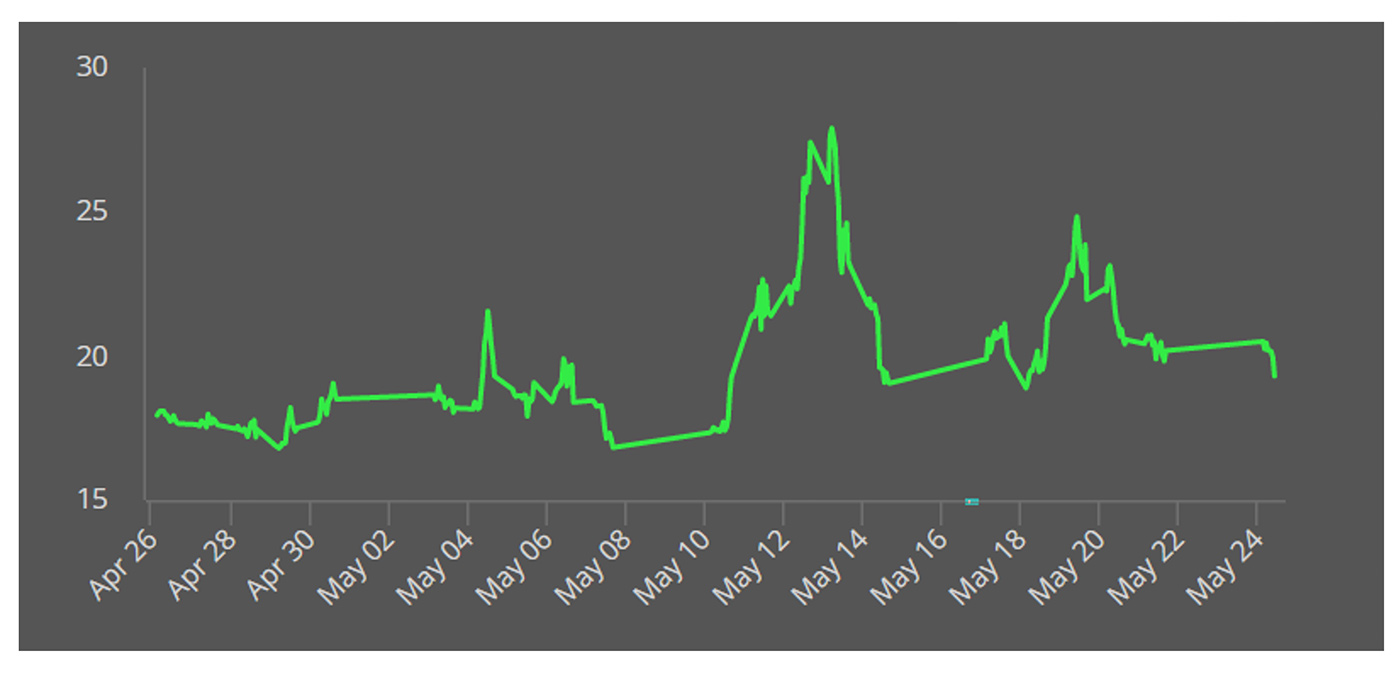
The Cboe Volatility Index spiked over 25 midmonth and has been generally elevated throughout May compared to a more benign April.

Source: Cboe Exchange Inc.
The surprising miss of the employment report released on May 7 was one contributing factor to the market’s volatility.
April’s payroll numbers came in at just 266,000 jobs, well below forecasts for 975,000. It was one of the biggest misses in the history of the data series.
Then, according to Barron’s, “The consumer-price index rose 0.8% in April from March—more than quadruple expectations for a 0.2% rise.”
MarketWatch noted on the price data, “Rising inflation pressures are getting the blame for heightened stock-market volatility after data earlier this month showed the consumer-price index rose a hotter-than-expected 4.2% year-over-year in April. That prompted fears the Fed could move earlier than anticipated to begin pulling back on its monetary policy accommodation.”
Despite the hotter readings on inflation and the disappointing jobs report, there has been some positive economic news as well, which helped the VIX get back under 20 and market performance return to basically flat last week.
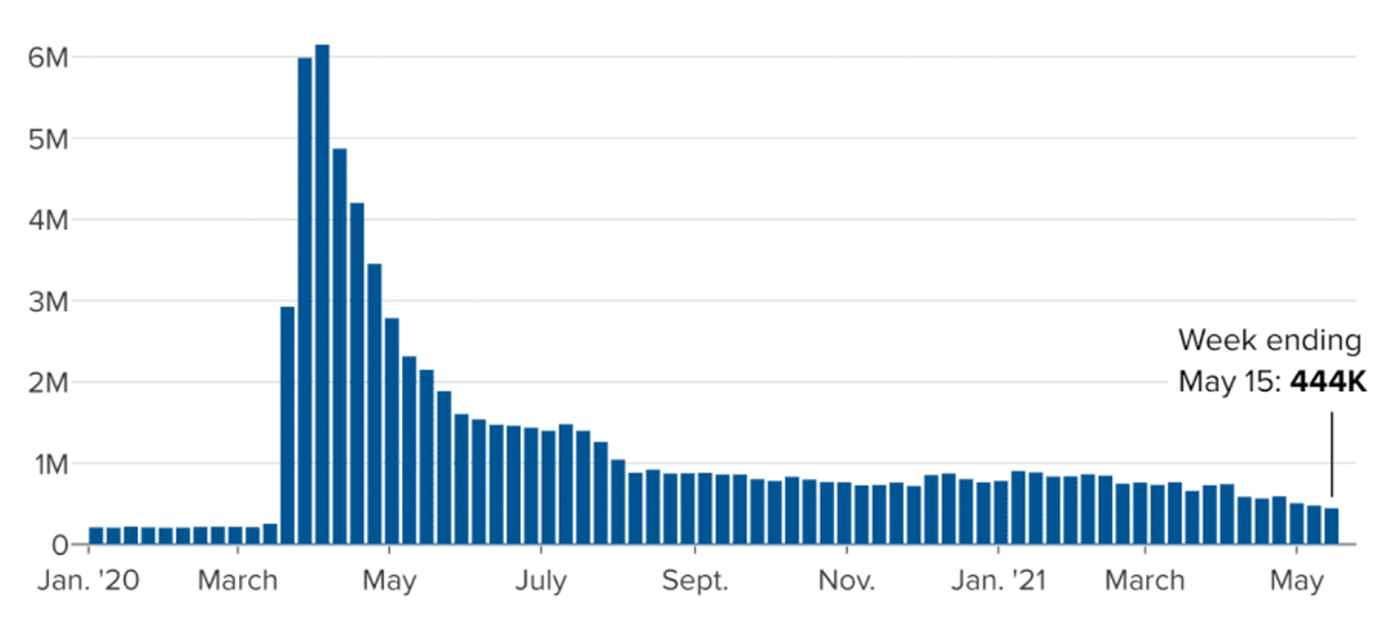
While continuing unemployment claims unexpectedly rose in the week ending May 15, the Department of Labor said new initial claims came in at 444,000, “a decrease of 34,000 from the previous week’s revised level. This is the lowest level for initial claims since March 14, 2020 when it was 256,000.”

Sources: CNBC, Department of Labor
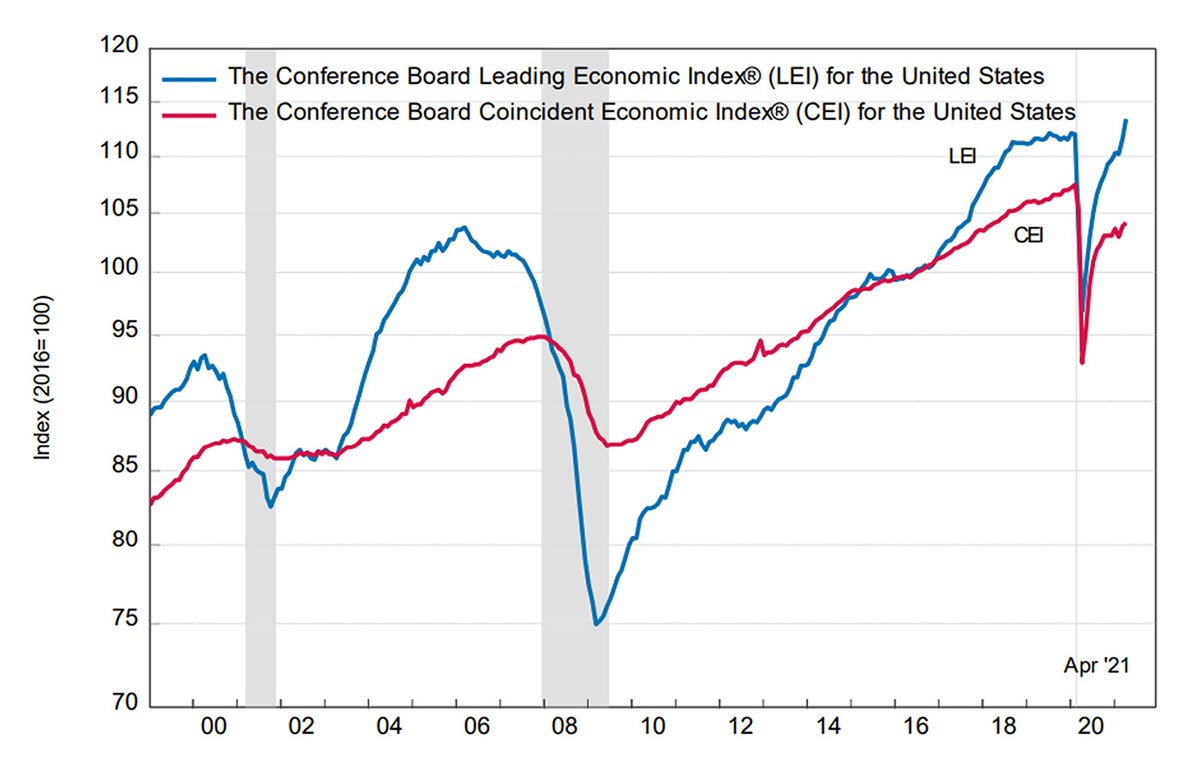
And The Conference Board Leading Economic Index (LEI) for the U.S. increased by 1.6% in April to 113.3, following a 1.3% increase in March.
The Conference Board remarked in its press release on May 20,
FIGURE 3: THE CONFERENCE BOARD LEADING ECONOMIC INDEX (LEI) FOR THE U.S.
INCREASED IN APRIL

Source: The Conference Board
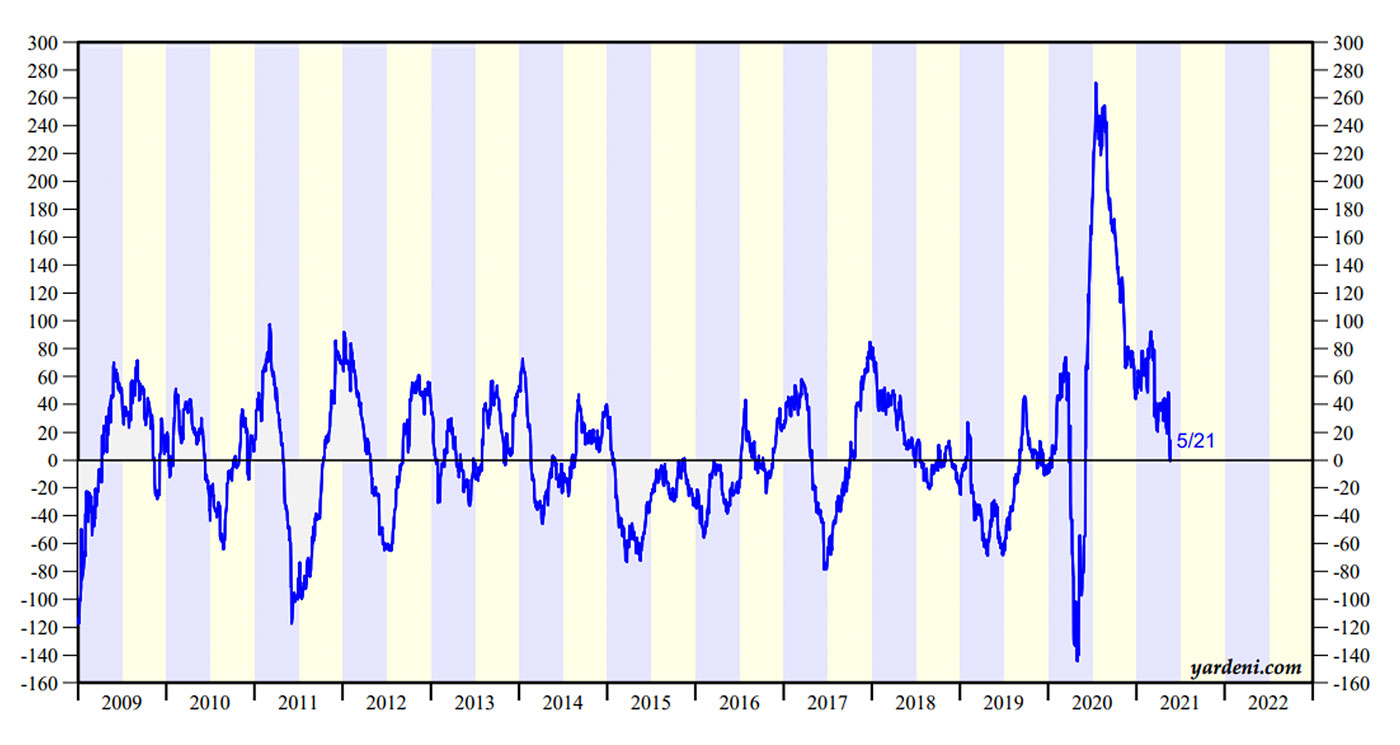
But Barron’s notes that, overall, “U.S. economic data has been mostly weaker than expected” recently:
“The Citigroup Economic Surprise Index, a measure of how much economic releases are beating or missing forecasts, has fallen from its highest level on record to about flat, a sign that expectations were too low and are now too high.”

Sources: Citigroup, Yardeni Research
Bespoke Investment Group does not see anything particularly troubling in this reversion to the mean on economic surprises to the upside, noting that its proprietary Economic Indicator Diffusion Index has trended similarly but has been “consistently positive” for the past year, outside of an “eight day period last May and an eleven day period in January.”
