

Major U.S. market indexes recorded modest gains last week, with the Dow Jones Industrial Average (DJIA) and S&P 500 up about 0.6%. The Russell 2000 Index was an outperformer, up 1.3%. But while it was a relatively calm week, it represented yet another week of gains and a nine-week win streak for the Dow.
MarketWatch noted that last week’s closing numbers “capped the best start to a year for the Dow Jones Industrial Average and the S&P 500 since 1987, according to Dow Jones Market Data, measuring the first 36 trading sessions for those indexes at the beginning of a calendar year. Over that period, the Dow has rallied 11.6%, and the S&P 500 has risen 11.4%.”
An analysis by The Wall Street Journal of the S&P 500’s performance in years when the Index rose at least 10% in the first two months shows gains for the rest of the year in four of six cases, with the outliers being 1931 and 1987. Interestingly, in the four positive instances, gains during the remainder of the year were greater than the two-month start to the year in only one case, 1991. Nonetheless, the total yearly performance in those years was impressive.
TABLE 1: S&P 500 IN YEARS WITH DOUBLE-DIGIT START
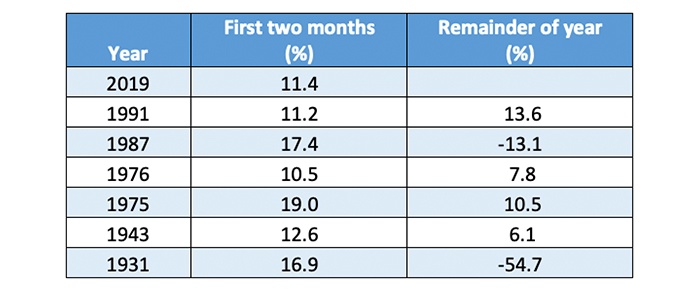
Source: Wall Street Journal
Bespoke Investment Group says market internals are looking strong:
FIGURE 1: CUMULATIVE ADVANCE-DECLINE LINE FOR THE S&P 500
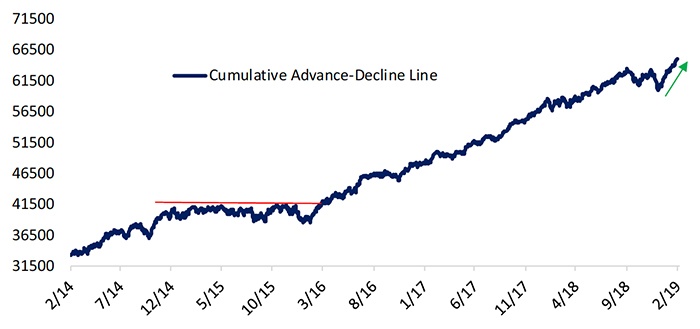
Source: Bespoke Investment Group
Bespoke’s analysis found eight other streaks of 100 trading days or more where the 50-day moving average 90% threshold was not crossed. When the 90% level is reached after such a “drought,” returns for the S&P 500 have averaged a gain of 5% over the next three months, and 9% over the next six months.
Improved market sentiment is clearly tied to the more dovish stance by the Fed on interest rates, a generally positive Q4 earnings season, and some optimism that progress will be made on a trade deal with China.
But these tailwinds are counterbalanced by cracks showing up in the global growth story. Some recent economic data points have not been encouraging:
- Germany’s purchasing managers’ index (PMI) for manufacturing, according to The Telegraph, “fell to 47.6 in February, down considerably from 49.7 in January and the lowest since December 2012. Any reading under 50 indicates contraction rather than expansion.”
- CNBC and Reuters report that “China’s car sales fell 16 percent in January, marking seven months of decline.”
- The Philadelphia Fed’s General Business Conditions Index, says Barron’s, came in at -4.1 for February, “in contraction for the first time since May 2016.” This was especially disappointing considering a consensus outlook range of 12.0 to 16.0.
- Bloomberg reported a week ago that “the global economy’s loss of momentum has left expansion now looking like its weakest since the global financial crisis.”
FIGURE 2: OECD COMPOSITE LEADING INDICATOR
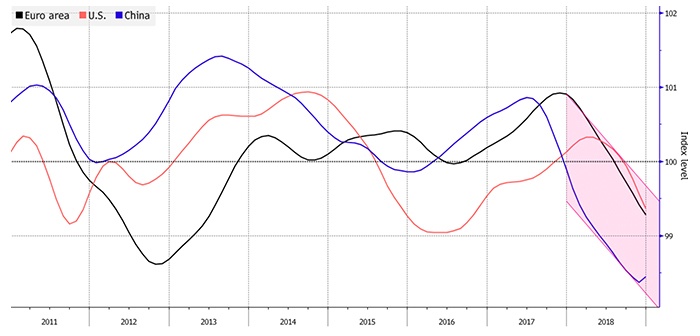
Sources: Bloomberg, OECD