FactSet reported last week that valuations for the S&P 500 have fallen recently, based on the price declines seen during the first two months of 2022:
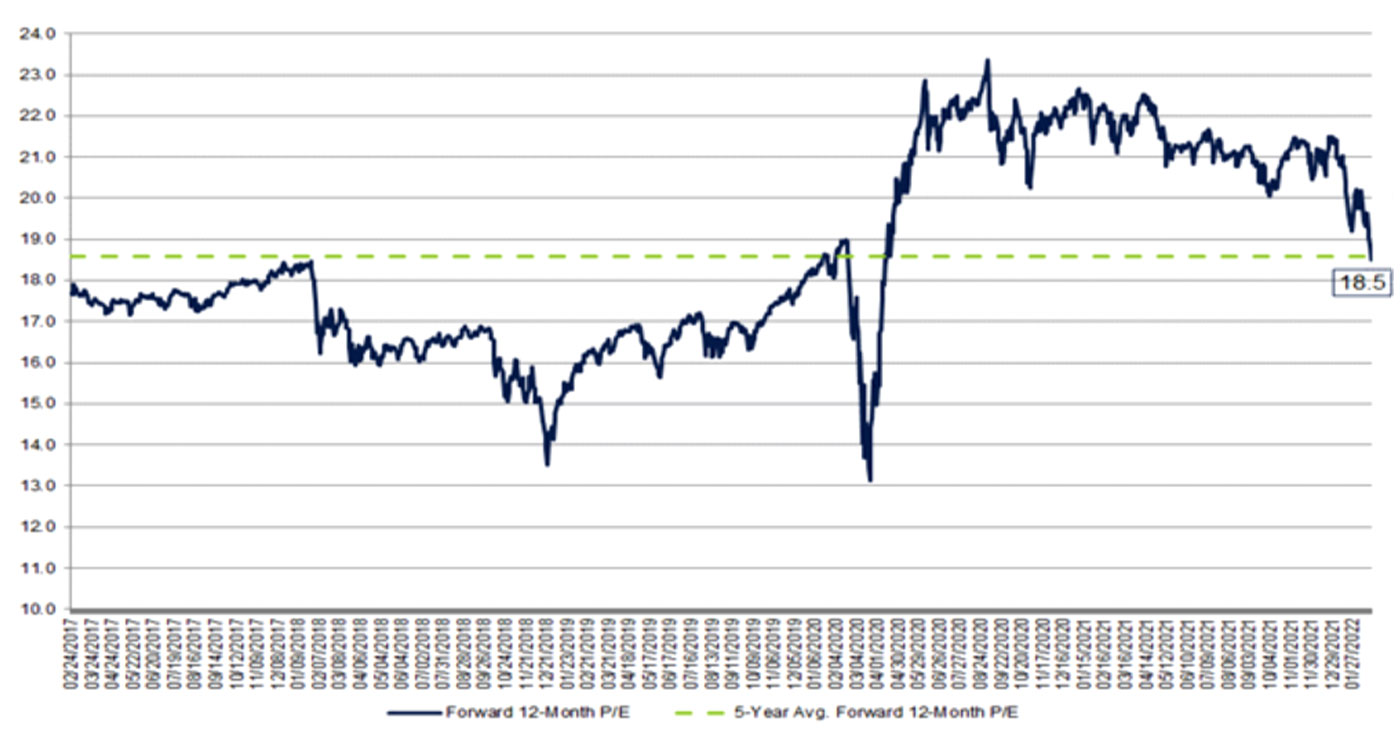
“On February 23, the closing price for the S&P 500 was 4225.50 and the forward 12-month EPS estimate for the index was $228.85. Based on this closing price and EPS estimate, the forward 12-month P/E ratio for the S&P 500 on that date was 18.5. How does this 18.5 P/E ratio compare to historical averages? How much has it changed in recent weeks?
“The forward 12-month P/E ratio of 18.5 on February 23 was below the five-year average of 18.6. However, it was still above the next four most recent historical averages: 10-year (16.7), 15-year (15.5), 20-year (15.5), and 25-year (16.5).
“In fact, this marked the first time the forward 12-month P/E ratio was below the five-year average of 18.6 since April 15, 2020 (18.4). However, the forward 12-month P/E ratio of 18.5 on this date was still well above the lowest P/E ratio of the past nine years of 13.1 recorded on March 23, 2020.”
FIGURE 1: S&P 500 FORWARD 12-MONTH P/E RATIO (5 YEARS)

Note: Data through Feb. 23, 2022.
Source: FactSet
Q4 2021 earnings update
According to FactSet, the Q4 2021 earnings season was the fourth straight quarter with earnings growth above 30%. With about 95% of companies having reported results, FactSet notes the following:
- “76% of S&P 500 companies have reported a positive EPS surprise and 78% of S&P 500 companies have reported a positive revenue surprise.”
- “The blended earnings growth rate for the S&P 500 is 30.7%.”
- “Nine sectors are reporting higher earnings today (compared to December 31) due to upward revisions to EPS estimates and positive EPS surprises.”
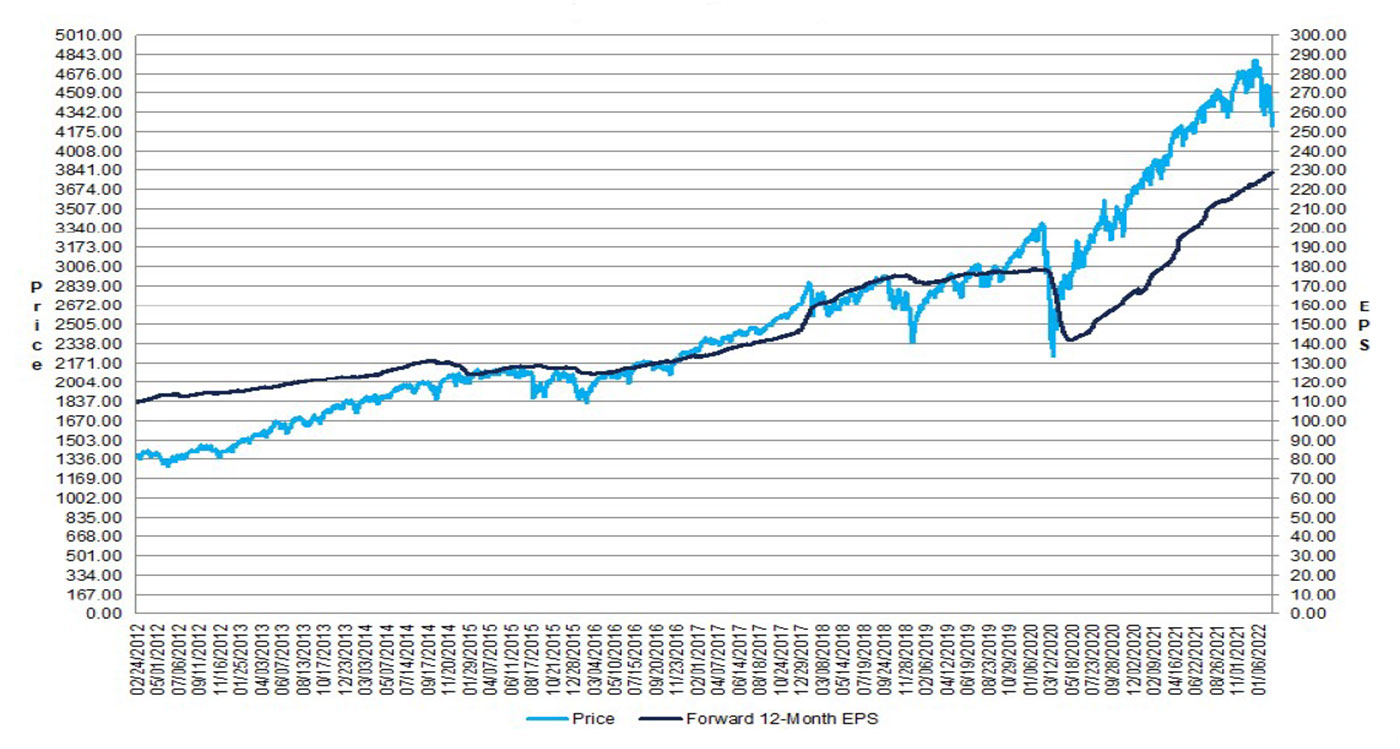
As can be seen in Figure 2, EPS growth has been steadily higher since the pandemic-induced downturn in 2020.
FIGURE 2: S&P 500 CHANGE IN FORWARD 12-MONTH EPS VS. CHANGE IN PRICE

Source: FactSet
Q1 2022 and full-year 2022 earnings outlook
FactSet says that analysts are forecasting earnings growth of 4.6% and revenue growth of 10.2% for Q1 2022. More S&P 500 companies than average are reporting negative EPS guidance (70% of 88 companies issuing guidance so far).
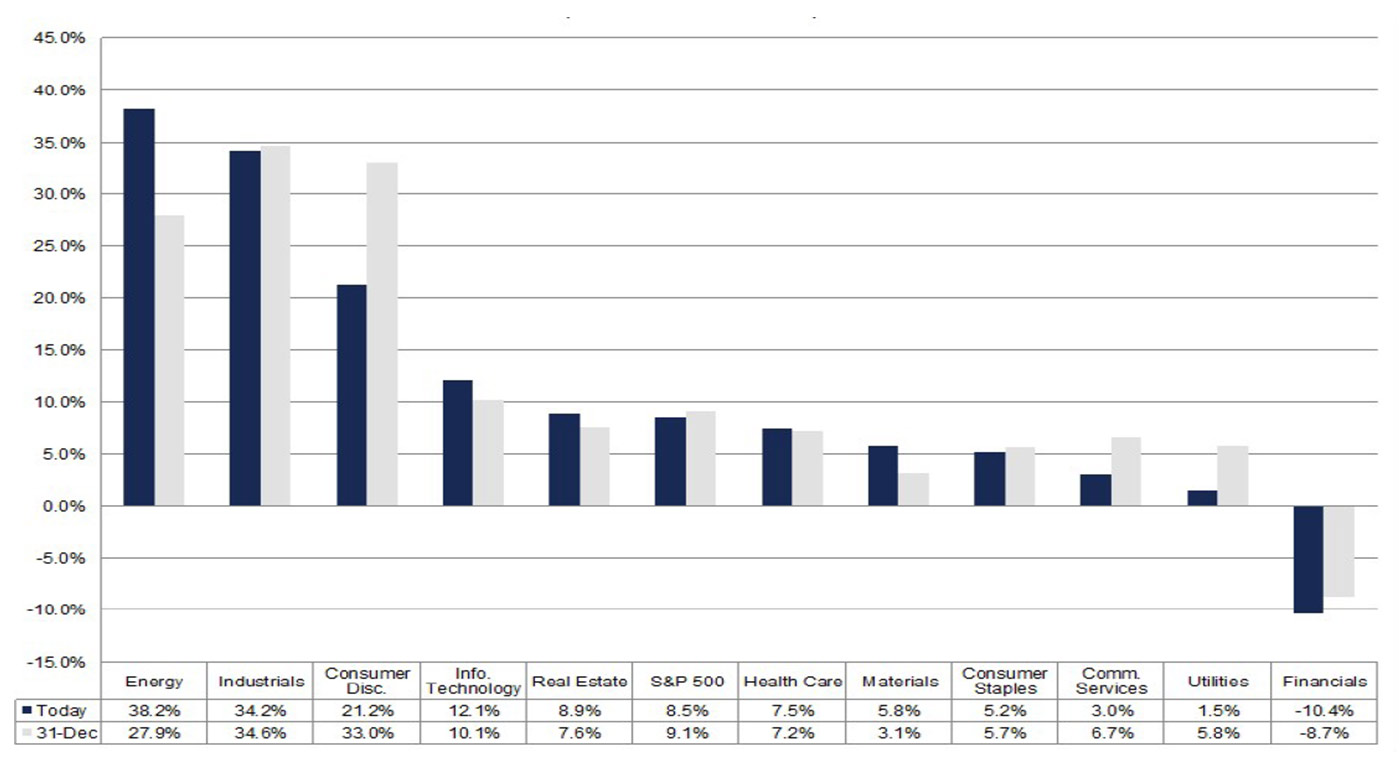
For calendar year 2022, says FactSet, analysts are projecting earnings growth of 8.5% and revenue growth of 8.1%.
For full-year 2022, analysts see the Energy sector as leading all sectors in earnings growth, up 38.2%.
FIGURE 3: FORECAST OF S&P 500 EARNINGS GROWTH BY SECTOR (CALENDAR YEAR 2022)

Source: FactSet
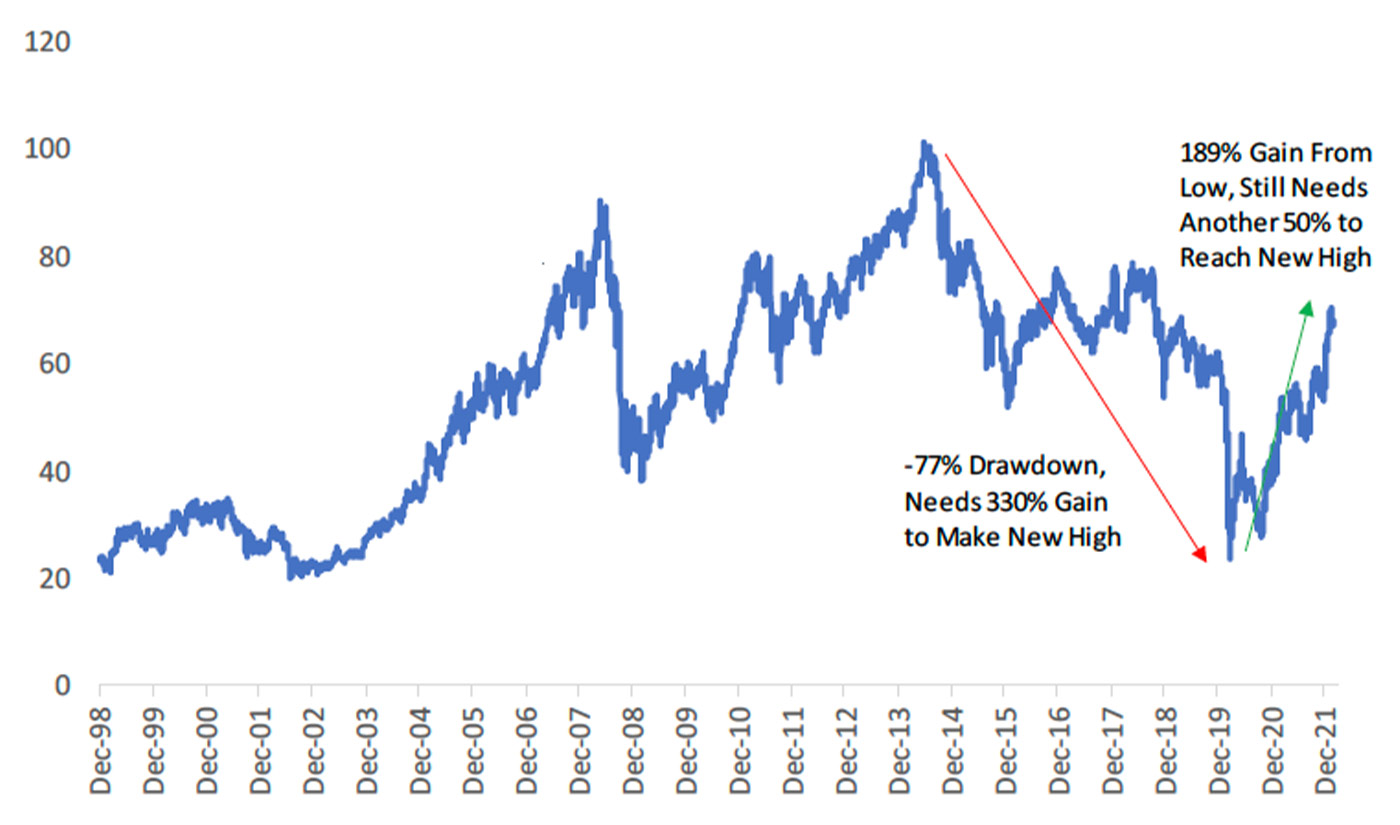
Despite the recent gains for the Energy sector (XLE) in terms of price trend, and the forecast of continued earnings growth, the sector still has a long way to go to reach former price highs.
Bespoke Investment Group writes,
“The gains for the Energy sector have indeed been massive over the last two years, as it has easily been the best performing sector post-COVID Crash. … From its high in 2014 to its low in March 2020, XLE fell 77%. That drop meant it needed to gain 330% to get back to its all-time high. Even after a massive gain of 189% since its COVID Crash low, XLE still needs to rally another 50% to get back to prior highs.”
FIGURE 4: S&P 500 ENERGY SECTOR ETF (XLE) SINCE 1998

Source: Bespoke Investment Group
New this week:
