

It is not surprising that investor confidence headed south in October, with major U.S. equity indexes posting large monthly losses.
According to CNBC,
- “The S&P 500 lost 6.9 percent in October, its biggest one-month slide since September 2011, when it fell 7.2 percent.
- “The Dow dropped 5.1 percent to post its biggest monthly fall since January 2016, when it dropped 5.5 percent.
- “The NASDAQ plunged 9.2 percent, its largest monthly pullback since November 2008, when it shed 10.8 percent.”
What is a little surprising is that the steep decline in institutional investor exposure to the markets (thought to be a more reflective measure of true risk appetite) began back in the late spring and early summer and continued through October.
For U.S. institutional investors, this undoubtedly reflected concerns over the uncertain prospects for continued strong corporate earnings growth, the impact of tariffs and trade wars, and the anticipation that the Fed would continue its path of rate hikes. For institutional investors outside of the U.S., they have been faced with rocky equity markets for most of 2018. Several overseas country indexes have seen double-digit percentage declines for the year, and the Dow Jones Global Index Ex-U.S. was down 11.4% through November 2.
Barron’s noted last week,
“Global institutional investors continued to decrease their exposure to equities in October, according to State Street, whose Investor Confidence Index based on the actual portfolios of their institutional clients fell to 84.4, down 3.4 points from September’s revised reading. Confidence among European investors waned the most, with the European sub-index falling 9.3 points to 90.9. More moderate declines were seen in the index for North America, which fell 2.6 points to 81.8 while the Asian component fell 0.3 points to 99.6.
“State Street noted that the index gave an early signal warning to October’s sharp sell-off in major global equity markets, when the index fell sharply in the prior two months as institutional investors pared back their holdings despite major stock indices hitting record highs. Their concerns about high valuations and whether earnings have peaked continue to prompt risk aversion, which in Europe is reinforced by disappointing growth and rising political risks.”
FIGURE 1: STATE STREET INVESTOR CONFIDENCE INDEX
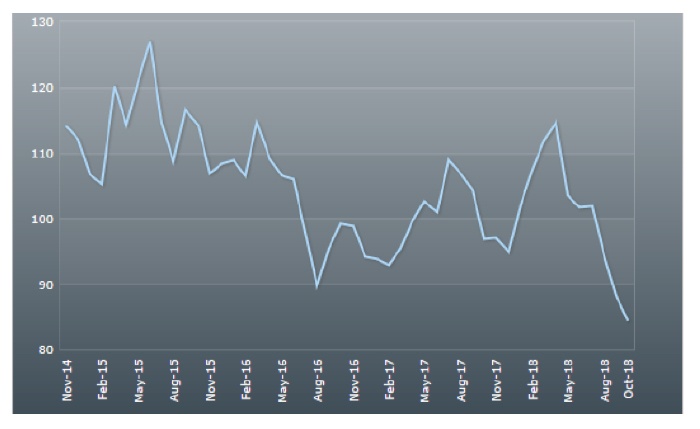
Note: Reflects combined global data.
Source: Barron’s, State Street
State Street reviewed its methodology and commented on this month’s report in a press release on October 31:
“The Investor Confidence Index was developed by Kenneth Froot and Paul O’Connell at State Street Associates, State Street Global Exchange’s research and advisory services business. It measures investor confidence or risk appetite quantitatively by analyzing the actual buying and selling patterns of institutional investors. The index assigns a precise meaning to changes in investor risk appetite: the greater the percentage allocation to equities, the higher risk appetite or confidence. A reading of 100 is neutral; it is the level at which investors are neither increasing nor decreasing their long-term allocations to risky assets. The index differs from survey-based measures in that it is based on the actual trades, as opposed to opinions, of institutional investors.
“‘As major stock indices were hitting record highs near summer’s end, there were signs that institutional investors were reducing risk exposure,’ commented Froot. ‘As we’ve progressed into fall, equities have declined further as the VIX has doubled. In the U.S., this month’s sell-off erased all 2018 year-to-date equity market gains, and amid concerns about high valuations and whether earnings may have peaked, some market participants seem to be anxious over a prolonged period of risk aversion.’”
According to the AAII (American Association of Individual Investors) Investor Sentiment Survey, individual investors remain about evenly split between bullish and bearish attitudes, with last week’s positive market results in the U.S. helping to give a large weekly lift to bullish sentiment.
FIGURE 2: INVESTOR SENTIMENT
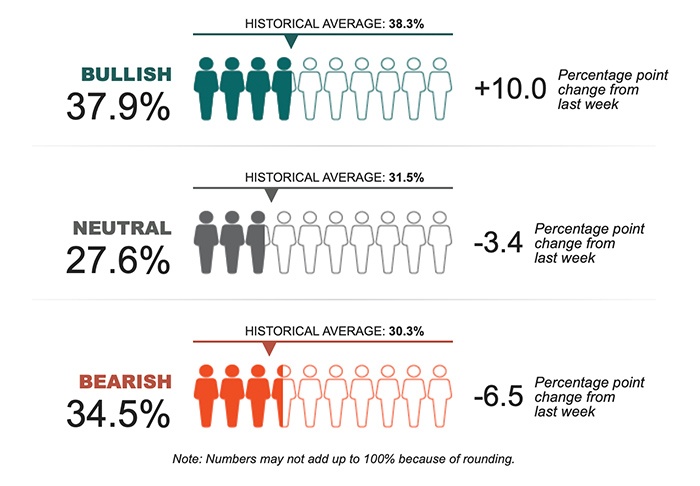
Source: American Association of Individual Investors
The good news for all investors can be found in historical analysis of postelection equity market results in midterm election years. MarketWatch recently wrote,
“Since 1946, there have been 18 midterm elections. Stocks were higher 12 months after every single one. Every single one. That’s 18 for 18. Even though we’ve had every possible political combination in the past 72 years. Republican president with Democratic Congress. Democratic president with Republican Congress. Republican president and Congress. Democratic president and Congress. Since 1946, stocks have risen an average of 17% in the year after a midterm.”