
Can investing in gold create a more optimal portfolio allocation?

The role of gold in investment portfolios: Part II
Updated analysis supports an optimal portfolio allocation to gold of 25%.
Editor’s note: A revised and updated version of this article can be found here.
Flexible Plan Investments, an active money manager and provider of risk-managed investment services, first authored an extensive analysis of the role of gold in investment portfolios in 2013. This white paper has been recently updated and is being presented as a guest commentary in two parts in Proactive Advisor Magazine. Last week’s Part I examined broad issues related to how investing in gold performed in specific market environments.
We are pleased to present Part II here, which looks more closely at gold’s performance in classic market regimes and offers broad conclusions on optimal gold allocations for investment portfolios. This analysis suggests an optimal gold allocation of 25%, which produced higher risk-adjusted returns than any other portfolio alternative.
But, how does gold perform under different classic economic regimes?
A popular concept in modern portfolio theory is the “All Weather” definition of economic regimes, with four different “states of the world” characterized by either rising or falling inflation and rising or falling economic growth. Bridgewater Associates, the large and very successful hedge fund mentioned earlier, has developed a simple conceptual graph to capture this idea (Figure 9).
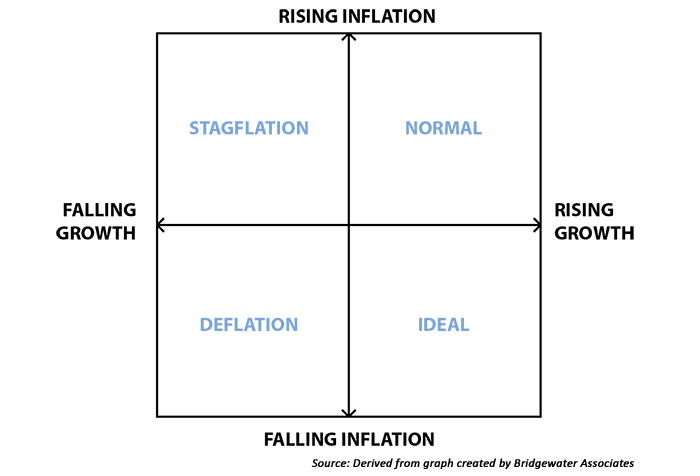
“Normal”: Real economic growth rate (GDP) is rising and inflation (CPI) is rising.
“Ideal”: Real economic growth rate (GDP) is rising and inflation (CPI) is falling.
“Stagflation”: Real economic growth rate (GDP) is falling and inflation (CPI) is rising.
“Deflation”: Real economic growth rate (GDP) is falling and inflation (CPI) is falling.
Figure 10 shows the relative frequency of these different economic regimes over the 43-year time period that was studied. As you can see, the most frequently occurring economic state (77%) was what we call “Normal,” characterized by rising economic growth and rising/moderate inflation.
Since 1981, Flexible Plan Investments (FPI) has been dedicated to preserving and growing wealth through dynamic risk management. FPI is a turnkey asset management program (TAMP), which means advisors can access and combine FPI’s many risk-managed strategies within a single account. FPI’s fee-based separately managed accounts can provide diversified portfolios of actively managed strategies within equity, debt, and alternative asset classes on an array of different platforms. FPI also offers advisors the OnTarget Investing tool to help set realistic, custom benchmarks for clients and regularly measure progress. flexibleplan.com
investment portfolios
by Flexible Plan Investments explores
why investors should reconsider
their portfolio’s allocation to gold.
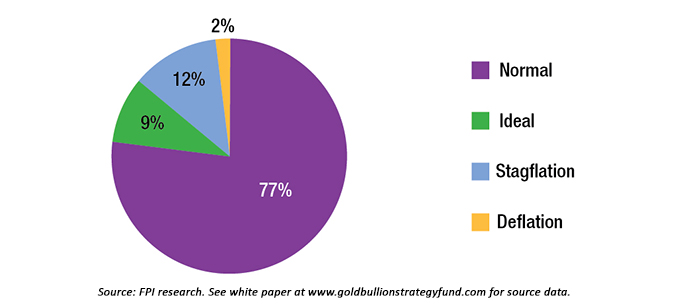
Finally, “Ideal” conditions are defined as the period where inflation is falling but economic growth is robust and rising. This regime was present roughly 9% of the time. This is a great environment for business expansion and for investors in many asset classes. The 1990s is the best example in recent U.S. history of an “Ideal” period.
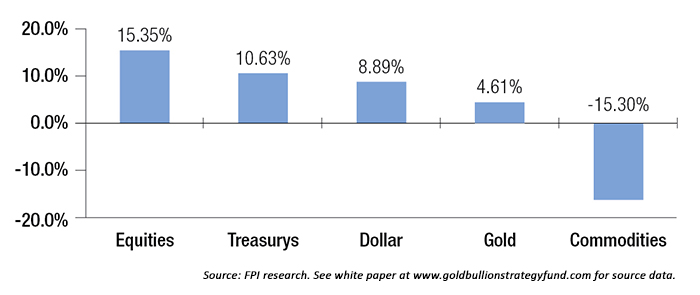
Figures 11 through 14 summarize the performance of the various asset classes during each of these economic regimes.
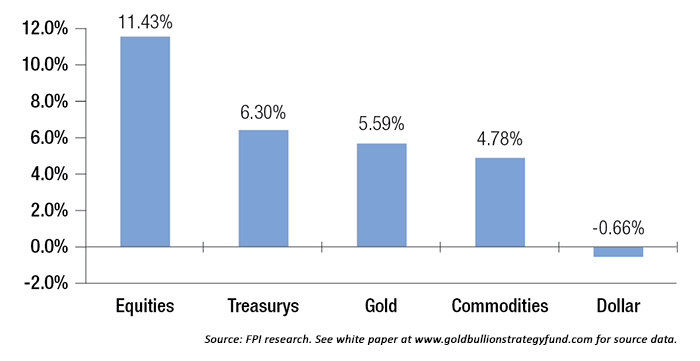
- In the most commonly occurring circumstance of “Normal” economic conditions, gold finished a close second to equities in terms of average annual return.
- In “Ideal” conditions, equities provided the best performance.
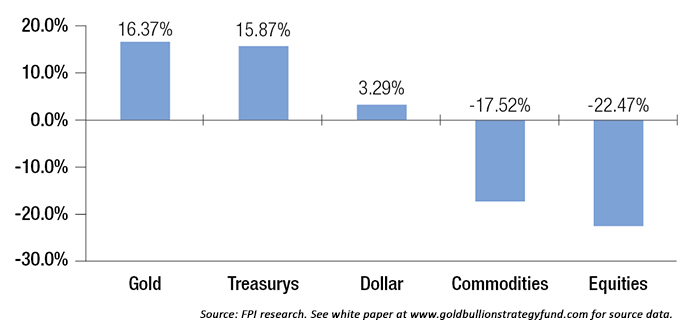
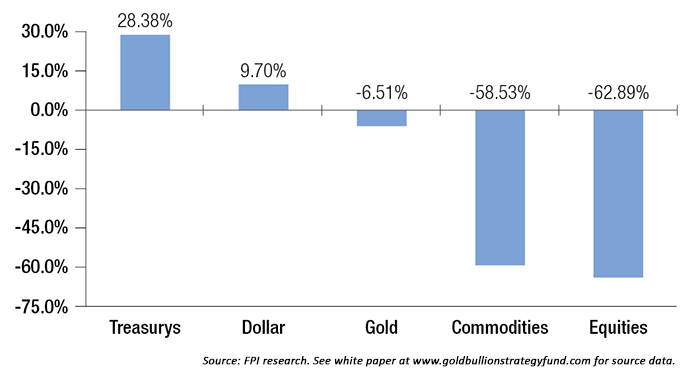
- However, in the two most negative economic regime conditions, gold far outperformed equities. In fact, in times of “Stagflation,” gold provided vastly superior returns to any other asset class.
- “Stagflation” tends to happen slightly more frequently than “Ideal” economic conditions (12% versus 9%), creating quite an interesting “trade-off” between gold’s performance and that of equities under these two regimes. Gold provided positive returns during both periods, while equities only had positive returns in one. Still, gold underperformed equities significantly during “Ideal” conditions. Yet, during periods of “Stagflation,” gold’s 16.37% annualized gain versus equities’ 22.47% loss is certainly a compelling statistic.

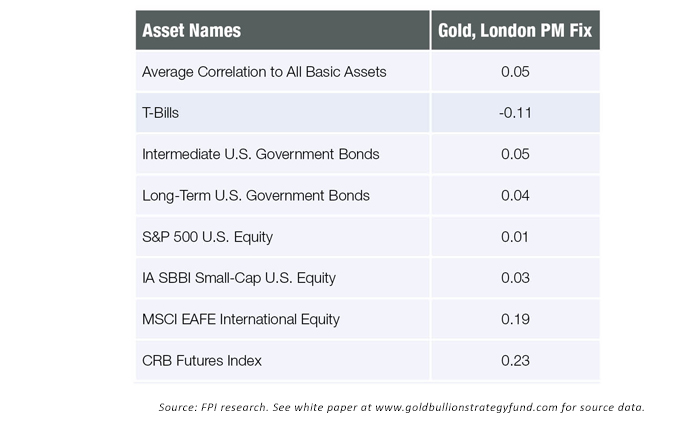
As Figure 15 illustrates, gold provided a low correlation to both stocks and bonds and did not move in tandem with traditional asset classes.
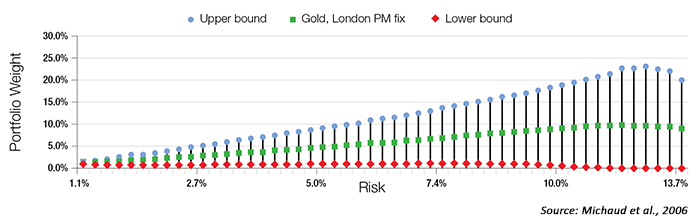
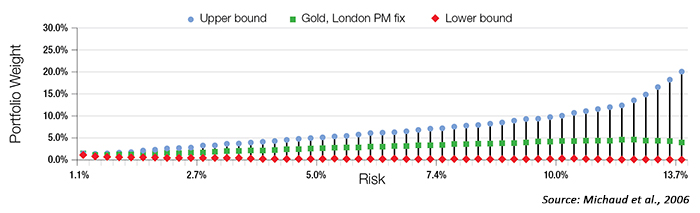
In a 2006 study, Richard Michaud, Robert Michaud, and Katharine Pulvermacher of New Frontier Advisors demonstrated that gold was part of the optimal portfolio for investors at all levels of risk preference tolerances—not just for a balanced investor. Adjusting for uncertainty and seeking the most robust solution, Michaud et al. found that for risk-level tolerances consistent with a balanced investor (around 10% risk), the optimal allocation to gold was found to be above 10% in the base-case scenario using multiple asset classes and historical market data.
Figure 16 is from the Michaud et al. study. It shows the optimal portfolio weight in gold and the maximum (upper) and minimum (lower) allocations at different levels of target portfolio risk.

But, has gold boosted risk-adjusted returns for a more typical portfolio? What has the optimal allocation to gold been for a typical portfolio?
These are more important questions than finding the optimal allocation across a broad universe of asset classes that are more commonly held in large pension portfolios.
First, we define typical: The most common portfolio is one that contains a 60% allocation to equities and a 40% allocation to bonds, or what the literature might refer to as a traditional “balanced portfolio.”
As a test of gold’s possible diversifying power, we can use this typical portfolio and add an allocation to gold to determine whether we can increase risk-adjusted returns. We will represent stocks in the portfolio with the Vanguard Total Stock Market Index, and for bonds we will use the 10-year Treasury Total Return Index. (See Table 2.)
Figure 18 shows the risk-adjusted return ratio (Sharpe) as a function of the allocation to gold from 1973 to Dec. 31, 2015.
Note that all of the blue “dots” left of the vertical center line are portfolios that dominate a balanced portfolio in terms of risk-adjusted returns. In finance parlance, these portfolios are considered to lie on the “efficient frontier.” Table 2 shows a more complete breakdown, providing data points for various levels of allocation to gold and the resulting total portfolio risk/reward ratio. All portfolios with allocations to gold highlighted in green have been superior to a traditional balanced fund in terms of risk/reward ratio (0.74).
As Table 2 demonstrates, it has been possible to allocate as much as 45% to gold in a portfolio and still have a superior risk/reward ratio to a portfolio that only holds a balanced fund. The optimal allocation from a risk/reward standpoint has been to allocate 25% to gold and 75% to a balanced portfolio.
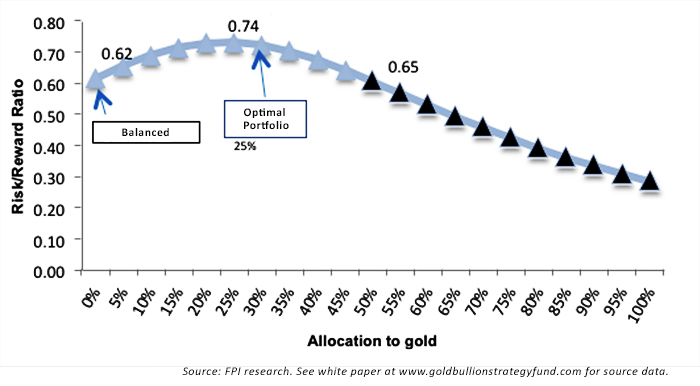
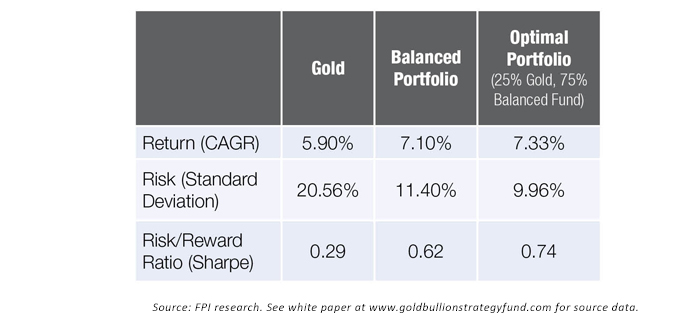
Table 3 compares this “optimal portfolio” with both gold and a balanced portfolio.
Both the optimal (25%) and upper range of efficient portfolios (45%) may seem fairly high relative to the 5% “rule of thumb” allocation to which a large number of financial advisors seem to subscribe. But there is precedent. The “Permanent Portfolio” by Harry Browne recommends an equal weighting (25%) across stocks, bonds, cash, and gold as being optimal across different economic regimes. We believe the evidence presented here strongly suggests that the current prevailing “conventional wisdom” greatly understates the potential role of gold in portfolios for a typical investor over the long term.
For investors, who have understandably grown more concerned about capital preservation in times of macroeconomic risk, but who are still looking for optimized returns, gold should be strongly considered as a key portfolio element. Over the long term, gold offers the broad benefits of (a) ongoing marketplace demand in the face of limited supply; (b) historic protection from extreme market events, high periods of inflation, and devalued currencies; (c) a time-tested component of portfolio diversification; and (d) liquidity and versatility in terms of the many forms of ownership possible for an investor.
This article presents an excerpt of the white paper, “The Role of Gold in Investment Portfolios.” The complete paper—including a list of source data and an appendix on the quantified definition of bull, bear, and sideways markets—can be found at www.goldbullionstrategyfund.com.
Past performance does not guarantee future results. Inherent in any investment is the potential for loss as well as profit. A list of all recommendations made within the immediately preceding 12 months is available upon written request.
This white paper is provided for information purposes only and should not be used or construed as an indicator of future performance, an offer to sell, a solicitation of an offer to buy, or a recommendation for any security. Flexible Plan Investments, Ltd., cannot guarantee the suitability or potential value of any particular investment. Information and data set forth herein has been obtained from sources believed to be reliable, but that cannot be guaranteed. Before investing, please read and understand Flexible Plan Investments, Ltd., ADV Part 2A and Part 2A Appendix 1.
The original white paper, published by Flexible Plan Investments November 2013, was written by David Varadi, David Wismer, and Jerry C. Wagner. The updated white paper, published in April 2016, was revised by Jerry C. Wagner, Jason Teed, and Liangbo Yu. flexibleplan.com