

Even while business and consumer confidence continues at high levels, the U.S. economy shows encouraging signs in many areas, and unemployment is near 50-year lows, many analysts and economists are keeping a close eye on the staggering debt levels in the U.S. and abroad.
In a recent interview on CNBC, Warren Buffett commented on the unprecedented relationship of key economic factors:
Veteran trader and newsletter writer Doug Kass echoed these thoughts in a Bloomberg interview this week, saying that he has never seen a time in his career when it takes as much debt to “create a unit of global GDP growth.”
In February, 2019, Kass cited burgeoning debt as one of the significant risk factors that could contribute to an end to the long U.S. equity bull market (in fact, Kass believes the market is already in a “topping-out process” and that “2018 marked the beginning of the end of the 10-year bull market”).
He wrote,
“The principal sources of my concern are continued political turmoil, the risk of policy errors, an unstable Administration, an untenable level of private and public market debt and a less-promising outlook for U.S. corporate profits and global economic growth. … [These conditions] provide an unsound foundation to markets that have had such a spirited rally.”
Here are six charts that provide a variety of perspectives on the current debt situation.
Bloomberg noted in March that, “The U.S. posted its biggest monthly budget deficit on record last month, amid a 20 percent drop in corporate tax revenue and a boost in spending so far this fiscal year. … February’s shortfall helped push the deficit for the first five months of the government’s fiscal year to $544.2 billion, up almost 40 percent from the same period the previous year.”
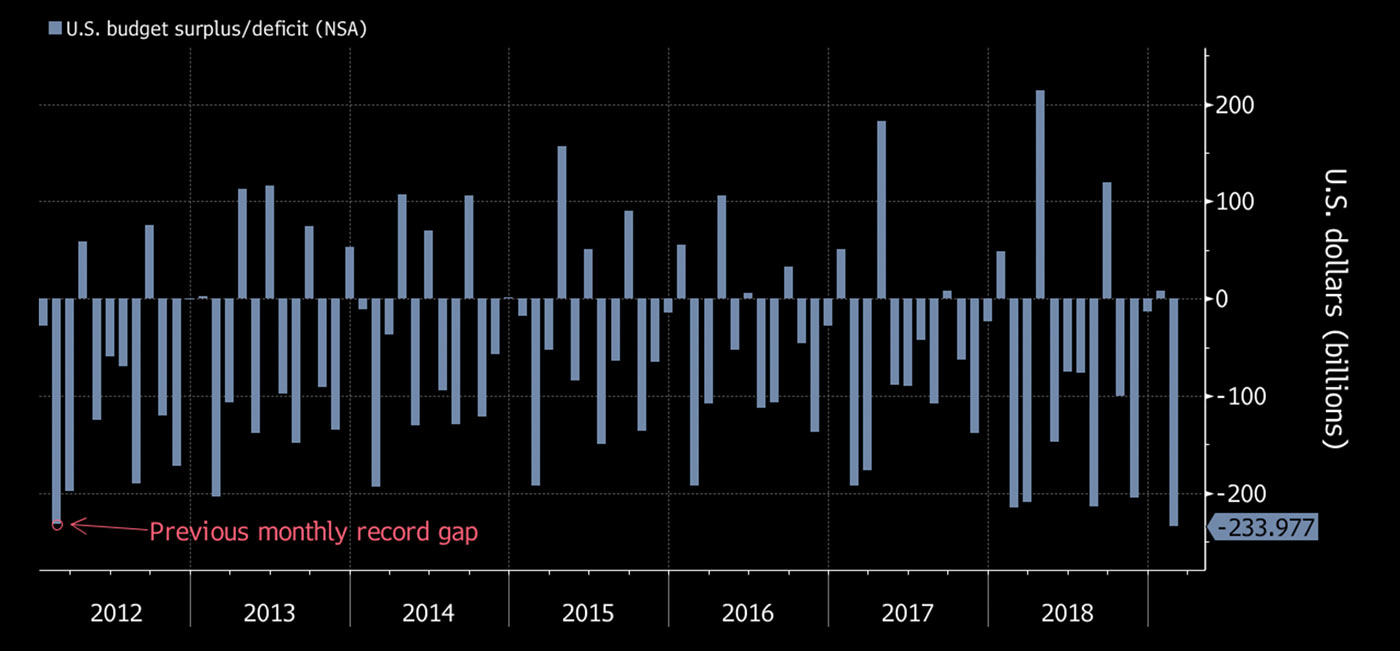
Source: Bloomberg, U.S. Treasury
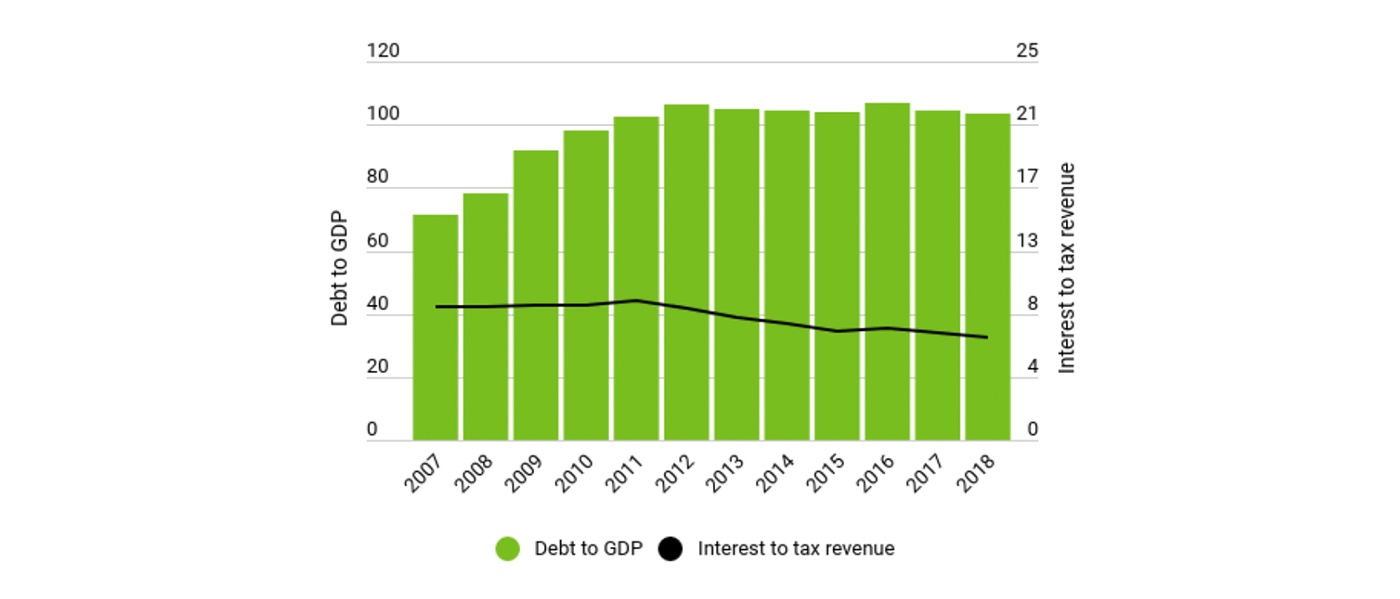
Federal debt as a percentage of GDP is hovering near its highest level in over the past 50 years.

Shaded areas indicate U.S. recessions
Source: Federal Reserve Bank of St. Louis
There has been little disagreement among analysts that corporate debt is at historical highs. But there is much debate over whether this poses a threat to the economy. Bullish analysts see the growth in debt as a function of low interest rates, a corporate thirst for funding growth, and rewarding shareholders via stock buybacks. Naysayers argue that a rise in interest rates and a recessionary period in the U.S. could lead to severe issues for overleveraged companies. One concerning factor, according to CNBC, was the fact that the cash-to-debt ratio for corporate borrowers fell to its lowest level ever in 2017.
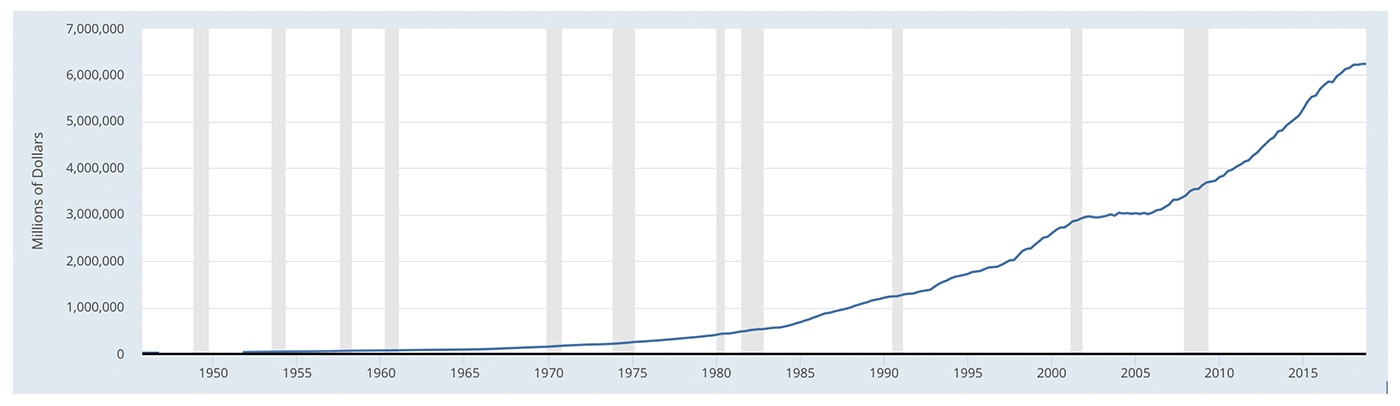
Shaded areas indicate U.S. recessions
Source: Board of Governors of the Federal Reserve System
Household debt, according to American Banker, “hit another record high last year, topping $13.5 trillion, but the pace of the increase—3% year over year—slowed somewhat.”
FIGURE 4: HOUSEHOLD DEBT TREND—STILL CLIMBING
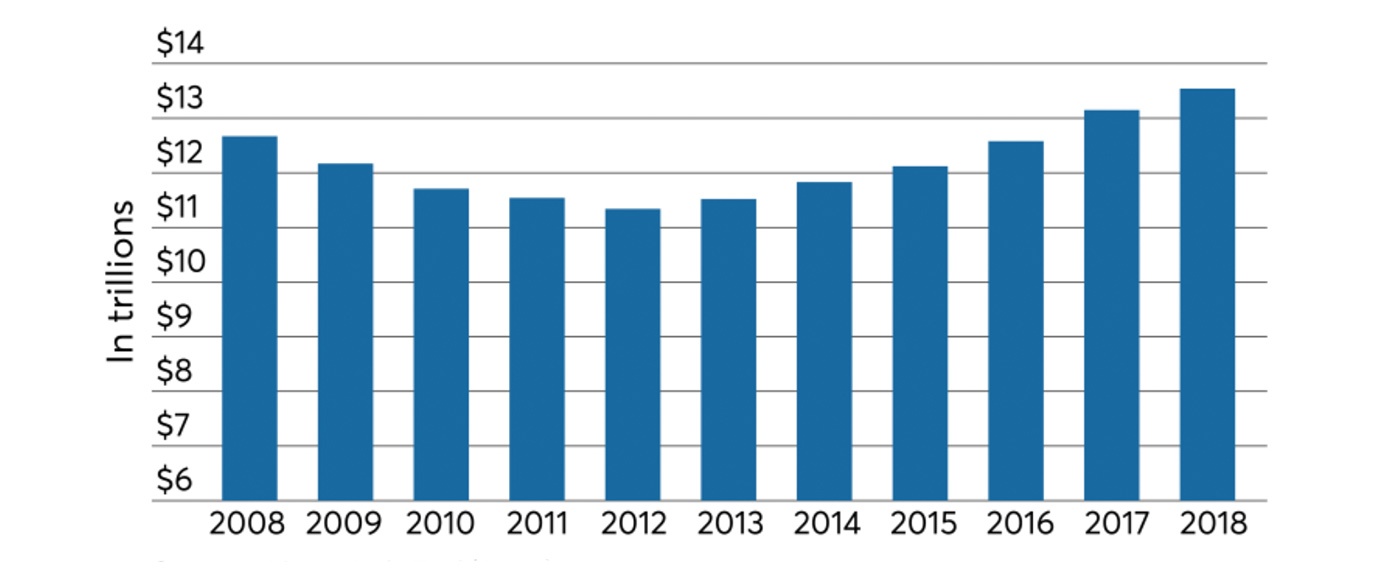
Source: New York Fed, Equifax
Despite some significant concerns about the ability of consumers to handle student loans and rising levels of auto loan delinquencies, the American Bankers Association does see positives in (a) the fact that debt as a percentage of disposable personal income has fallen significantly since the recession and (b) the rise in consumer debt has gone hand in hand with an improving labor market.
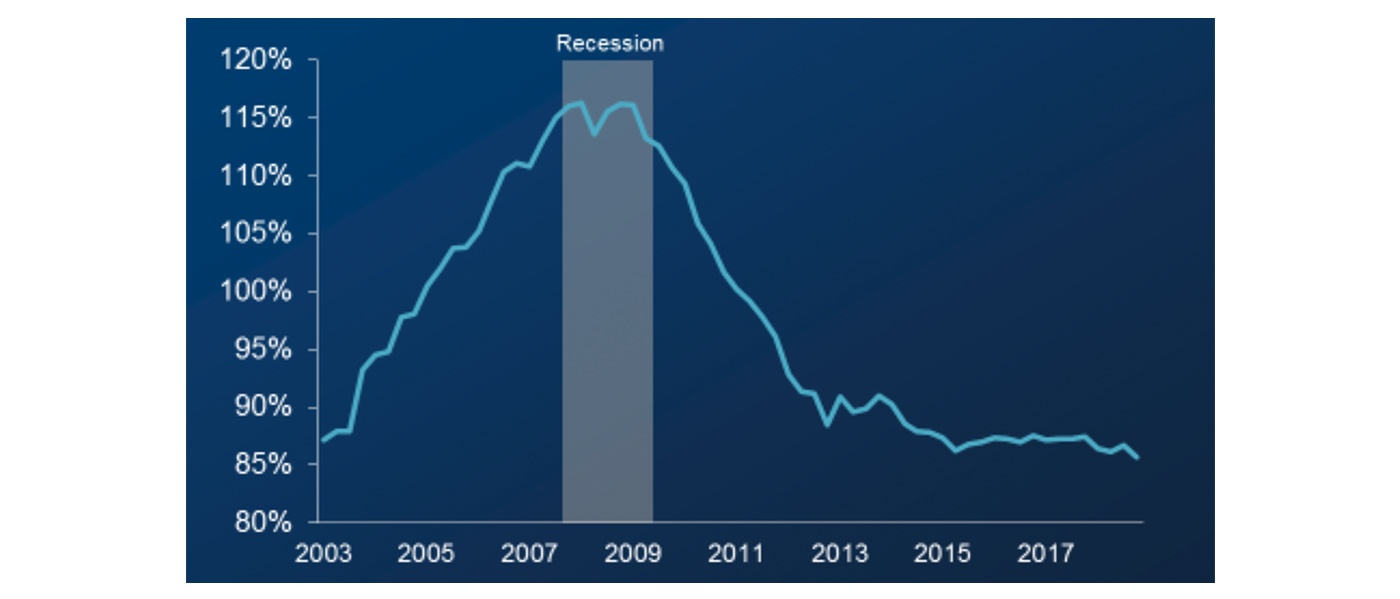
Source: Federal Reserve Bank of New York, Bureau of Economic Analysis
The International Monetary Fund (IMF) in an April article specifically took on the issue of rising debt levels around the world. The organization pointed out that in advanced economies, “Public debt is higher today than before the financial crisis.” Policymakers, says the IMF, should be “getting their fiscal houses in order by gradually lowering debt to prepare for the next downturn and upgrading fiscal policy to invest in people’s futures.”
Source: International Monetary Fund