


Money managers and investors alike have long heralded “yield-curve inversions” as one of the most reliable indicators of an impending bear market. Even today, various news outlets are littered with stories about recent dynamics in the yield curve and how it could warn of an impending bear market.
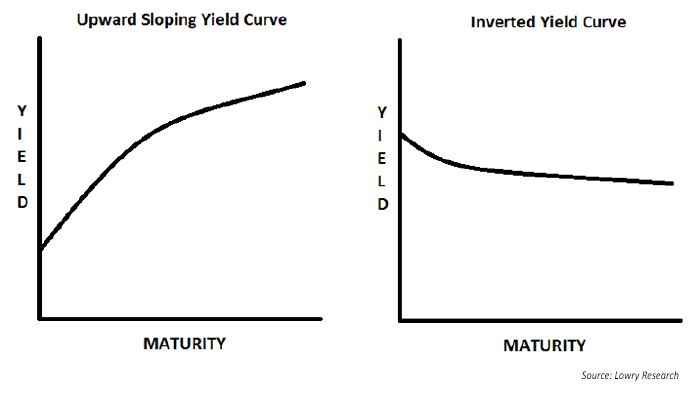
The yield curve is simply a graph of the yields of various Treasury bills, notes, and bonds, with different maturities. A graph of the yield curve will typically include the yields on Treasurys with maturities ranging from as short as three months to as long as 30 years. An upward sloping yield curve is normally associated with a strengthening economy and optimistic investors who believe growth will continue in the years ahead.
An inverted yield curve, however, is normally associated with an economy that may be showing signs of diminished growth. Investors, who become pessimistic about the future of the economy, purchase bonds with longer maturities to protect themselves from any future economic malaise. This drives down yields for Treasurys with longer maturities. When these yields fall below shorter-term yields, an “inverted yield curve” exists. Here are some examples.
UPWARD SLOPING YIELD CURVE & INVERTED YIELD CURVE
The reason why investors have placed so much emphasis on yield-curve inversions over time has likely been its generally reliable track record of warning of recessions. In fact, most of the major recessions in the United States over the past 50 years have been accompanied by, at some point or another, an inverted yield curve. The reliability of this indicator has been popularized to the point that a version of it is one of the major components of The Conference Board’s Leading Economic Index, which many professional investors use to help manage client portfolios and pooled funds.
Here, we will analyze the yield curve’s track record at predicting bear markets. What we find is that the media pundits and economists are right—yield-curve inversions have been associated with nearly every recession since 1962. But, there is a major difference between finding a reliable indicator for economic growth and applying it to the management of a stock portfolio. There are two readily apparent problems with using yield-curve inversions in portfolio management:
1. While bear markets are generally associated with recessions, bear markets unaccompanied by recessions may occur without a yield-curve inversion at all (e.g., 1976 and 1987).
2. For bear markets preceded by yield-curve inversions, the lead time before the stock market reaches its final bull market high could be a year or more. In some cases, inversions actually occurred after the stock market reached its ultimate peak.
For our analysis, we will define yield-curve inversions as when the yield on the one-year Treasury bill exceeds that of the 10-year Treasury bond. Many practitioners use the three-month or two-year Treasury yield instead of the one-year Treasury. As a compromise between the two methods, and due to data availability, we will use the one-year Treasury yield.
The lead time between yield-curve inversions
A major issue investors face when using yield-curve inversions as part of their investment process is that the time between the first yield-curve inversion during a bull market and the bull market peak can be long. This significant lead time can cause investors to become defensive too early and miss out on further opportunities for stock price appreciation. See Table 1 for the lead times between the first yield-curve inversions during bull markets and the ultimate peak in the Dow Jones Industrial Average (DJIA).
TABLE 1: LEAD TIMES BETWEEN INVERSIONS AND BULL MARKET PEAKS
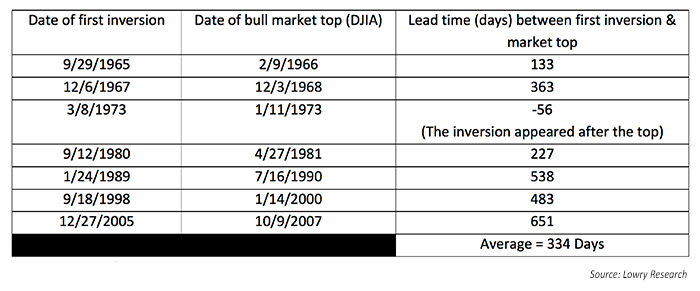
From Table 1, we can see that the one-year Treasury yield typically first climbs above the 10-year Treasury yield nearly a year in advance of the stock market’s final top. In more recent history, the lead time between yield-curve inversions and final bull market peaks was closer to 18 months. This highlights a potential major risk to investors—the risk of being too early. To put this risk in perspective, consider an investor who decides to be fully invested in the DJIA during a bull market until he identifies a yield-curve inversion. He then sells out of all of equities and holds cash. See Table 2 for how much money this investor would have “left on the table” following such a strategy.
TABLE 2: THE COST OF BEING TOO EARLY, EVEN IF EVENTUALLY RIGHT
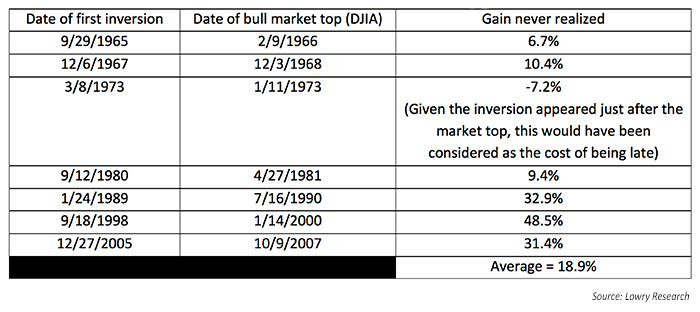
What is clear in Table 2 is that the cost of being too early in positioning defensively could result in sacrificing a significant amount of gains, especially prior to bear markets in the last three decades. This cost of missing out is put into perspective when considering the average yearly return of investing in the DJIA between 1965 and 2007 was roughly 8%. This means, on average, the cost of being early could result in missing out on what an investor might expect to earn in over two entire years. This brings into question whether yield-curve inversions should have any part in managing a stock portfolio.
Do yield-curve inversions have any value?
While this analysis suggests that yield-curve inversions may prove of limited value in real-time equity-portfolio management, yield-curve inversions still have significant value. The problem lies in that an inversion has historically been a reliable warning sign of an economic recession, but as investors, we invest in stocks, not economies. Moreover, even if most bear markets have been associated with economic recessions, investing with the intent of “being right eventually” is not a defensible investment process. Therefore, yield-curve inversions should most likely be viewed with passive interest, and investors should link the inversion only to the future state of the economy. Using inversions may help investors know when to be on the lookout for a recession, but the lead time between inversions and market tops can prove to be a challenging timing issue.
Lowry’s approach
For over 75 years, Lowry Research has specialized in helping our clients identify major market tops and make sure their portfolios are positioned properly up until the final bull market peak. Our methodology uses time-tested indicators based on the “law of supply and demand.” We do not use one indicator to identify a fatiguing bull market, but multiple measures of supply and demand to further confirm that a major market top and subsequent bear market are developing.
The opinions expressed in this article are those of the author and do not necessarily represent the views of Proactive Advisor Magazine. These opinions are presented for educational purposes only.
 Christopher Diodato, CMT, is a market analyst with Lowry Research, where he uses Lowry’s proprietary research methods and presents actionable findings to clients. Before joining Lowry Research, Mr. Diodato was a financial advisor with Morgan Stanley and a member of the portfolio management team at Cetera Retirement Services. In addition to holding the Chartered Market Technician (CMT) designation, he is a Level III candidate for the Chartered Financial Analyst (CFA) program. https://www.lowryresearch.com