Continuous record-breaking performance for U.S. equity markets has had many investment professionals questioning when the inevitable reversion to the mean will occur—not just for stock prices, but for other factors such as inflation, bond interest rates, commodity prices, and equity valuations relative to P/E measures.
This form of market skepticism has been in play for months for many analysts and years for others, adding fuel to the bull argument that market sentiment has not yet reached its upper limits.
Clearly, in the short term, most major U.S. indexes are in overbought territory. The S&P 500 has had 61 closing record highs in 2017, as of the end of last week (Oct. 20).
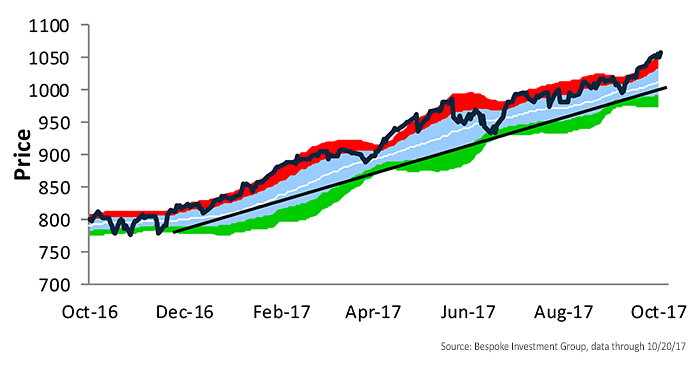
The NASDAQ 100, as represented by the QQQ ETF, has achieved a year-to-date gain of 26.6% (through Oct. 20), and the technology sector is pushing the upper limits of its current trend.
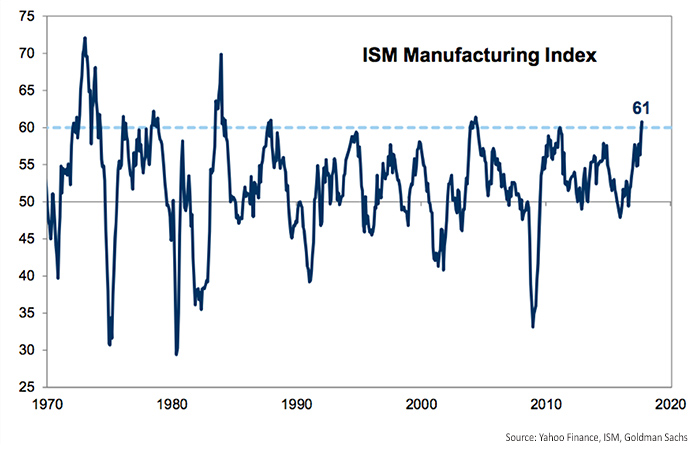
FIGURE 1: TECHNOLOGY SECTOR PRICE TREND
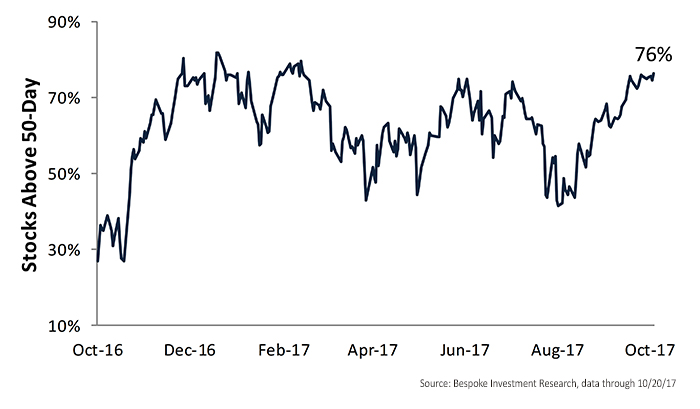
The S&P 500 recently had 76% of its stocks trading above their 50-day moving averages. While this is not unprecedented, even in the current bull market—and confirms the strong breadth of the market overall—this measure is reaching levels where it has pulled back over past months.
FIGURE 2: S&P 500—PERCENTAGE OF STOCKS ABOVE 50-DAY MOVING AVERAGE
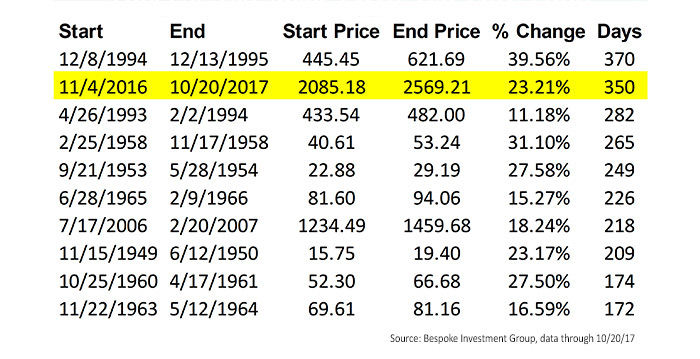
Bespoke Investment Group pointed out at the end of last week:
“New highs this week makes it 480 days since the last 5% pullback for the S&P 500 and 350 days since the last 3% pullback. Think about that. It’s been almost a year since the S&P had a drawdown of just 3% from a high. … The index just needs to make it another 21 days for this to be the longest rally without a 3% decline on record.”
FIGURE 3: LONGEST 3%+ RALLIES WITHOUT 3%+ CORRECTION
Goldman Sachs, according to Yahoo Finance, has distributed a note to clients warning of the odds that “peak growth” for the U.S. economy has been seen in the short term and the market is at risk of a pullback as growth measures ease. David Kostin at Goldman acknowledges “a synchronized global upswing has helped lift stocks.”
But he points out, “Although economic data are extremely strong now, an ISM reading above 60 typically marks the peak of growth and presages economic and equity deceleration. Since 1980, the ISM has exceeded 60 in eight separate episodes; four of those lasted only one month. … Investors buying the S&P 500 at ISM readings of 60 or higher have gone on to suffer negative three- and six-month returns on average as economic activity slowed.”
FIGURE 4: ISM MANUFACTURING INDEX RARELY EXCEEDS 60 OVER PAST 30 YEARS