

Over the past month, spot gold prices have risen over 3% and are more than 9% higher than the most recent lows seen in August 2018.
However, as can be seen in Figure 1, the price of gold appears to be in a long-term trading range over the past five years, cycling up and down between the $1,100 and $1,350 price areas.
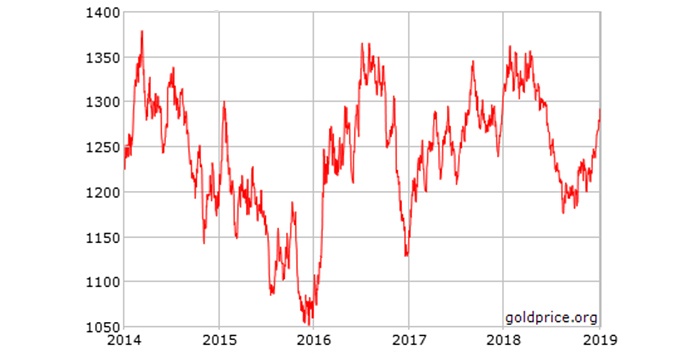
Source: goldprice.org
However, gold prices are still well below the extraordinary highs of the 2011–2013 period, as shown in the 20-year view in Figure 2.
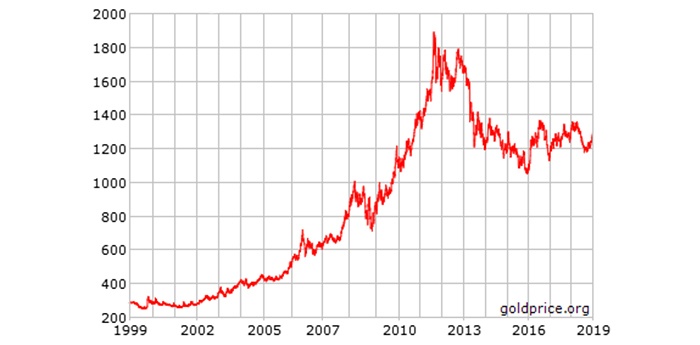
Source: goldprice.org
We featured an article by prominent market analyst Tom McClellan at the end of December, “Gold’s major cycle low due in February,” where Mr. McClellan noted,
It is not surprising that gold’s run higher in December was coincident with some recent weakness in the U.S. dollar, as seen in Figure 3.
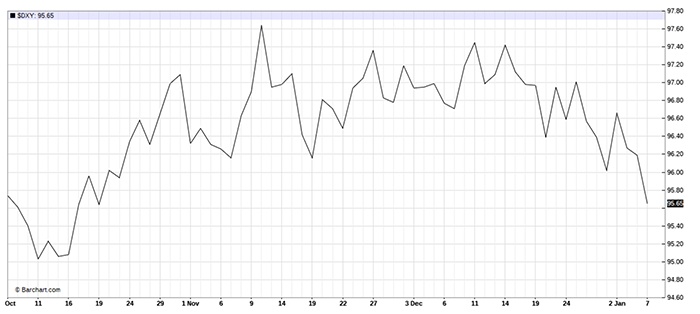
Source: barcharts.com
Bespoke Investment Group observed in its year-end analysis of various market sectors and 2019 outlook,
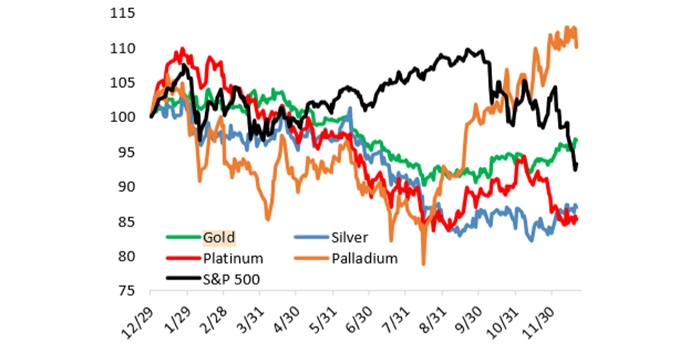
Source: Bespoke Investment Group
In December, the website GoldSilver.com presented an analysis of major financial institutions’ 2019 outlooks for gold prices. The consensus range of prices was from $1,250 to $1,500, with most estimates clustering around $1,300–$1,350.
Bank of America Merrill Lynch’s Francisco Blanch, head of global commodities and derivatives research, said, “Gold is set to surge over the next year as concerns deepen about the widening U.S. budget deficit and a tariff-driven trade war starts to damage the country’s economy. Bullion could average $1,350 an ounce in 2019 as corporate tax reforms worsen the U.S. fiscal balance.”
The question on everyone’s mind is what sort of economic regime is the globe facing in 2019? Are recent reports out of China and elsewhere a stern warning on slowing global growth? Is a recessionary period on the horizon for many of the world’s nations? Will the rate of inflation pick up or decline in the U.S. and other developed nations? What is the outlook for interest-rate moves on the part of the Fed and other central banks? What will the U.S. dollar’s position be versus other currencies, and how will commodities, especially gold and oil, fare in the new year?
Please take a look at two 2018 articles from Proactive Advisor Magazine that provide an extensive analysis of how gold fares during different economic regimes and how financial advisors and investors might appropriately view the role of gold in modern portfolio allocations. While concrete answers to macroeconomic issues are impossible to discern in advance, both articles articulate how gold may play an important long-term role for investors, especially in times of economic and market uncertainty.
- “How does gold perform in different market scenarios?” from Aug. 8, 2018.
- “What is the optimal portfolio allocation to gold?” from Aug. 22, 2018.