

It will be interesting to see if Federal Reserve chairman Jerome Powell’s “dovish” remarks on interest rates last week can help turn around a U.S. housing market that continues to show signs of weakness.
As was widely reported, Powell signaled that rates may not move as far or as fast as had been expected, saying they are “just below” estimates of neutral. According to the Financial Times, Powell’s remarks in a speech at the Economic Club of New York included the statement, “There is no preset policy path. We will be paying very close attention to what incoming economic and financial data are telling us.”
Equity markets responded with enthusiasm, with weekly gains for the Dow of 5.2%, 4.8% for the S&P 500, and 5.6% for the NASDAQ Composite.
There can be little doubt that one of the key contributing factors to a soft housing market has been the higher interest-rate path of the Fed over the past year and, prior to last week, expectations for several more increases in 2019.
Mortgage rates have backed off slightly but are still around seven-year highs. According to the Federal Reserve Bank of St. Louis, average 30-year fixed mortgages were at 4.81% last week.
FIGURE 1: U.S. 30-YEAR FIXED-RATE MORTGAGE AVERAGE
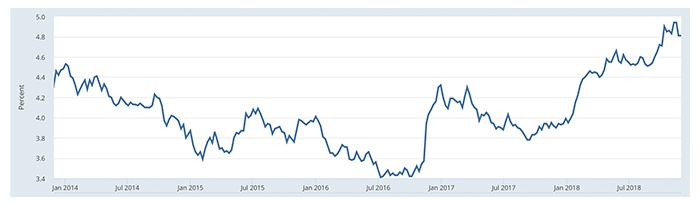
Source: Freddie Mac, fred.stlouisfed.org
Two key reports for the U.S. housing market were released last week, and both disappointed.
Barron’s noted of new home sales, which hit a three-year low,
“This year’s slump in new home sales extended into October. Sales in the month came in far below expectations at a 544,000 annualized rate in a disappointment offset in part by a net 50,000 upward revision to the two prior months.
“Yet sales of new homes have clearly been moving lower, hitting a peak of 712,000 in November last year and largely declining since. Year-on-year, new home sales are down 12.0 percent in today’s report in what is bad news for the nation’s Realtors and home builders.
“More bad news comes from prices where the median, at $309,700, fell 3.6 percent in October for a year-on-year decline of 3.1 percent. This is still far short of the decline in sales and hints at further price erosion ahead.”
FIGURE 2: NEW U.S. HOME SALES
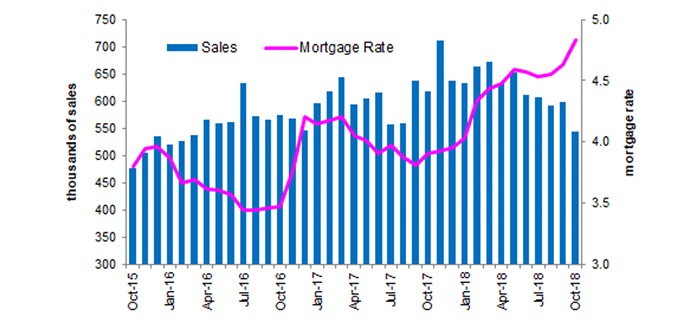
Sources: Barron’s, Haver Analytics, U.S. Bureau of the Census, U.S. Commerce Department,
and the U.S. Department of Housing and Urban Development.
The second report, on pending home sales, was released a day later, and MarketWatch provided this analysis:
“U.S. pending home sales slid 2.6% to a reading of 102.1 in October from 104.8 in September, the National Association of Realtors said Thursday. That was the lowest since June 2014. NAR’s index, which tracks real estate contract signings, was down 6.7% compared to a year ago. The report missed the Econoday consensus for an unchanged reading. Contract signings usually precede closings by about 45 days, so the pending home sales release is considered a leading indicator for the existing-home sales report. …
“Big picture: The housing picture is growing darker. The Realtors trade group now expects sales of existing homes to decline 3.1% in 2018, and another 0.4% in 2019. The group expects price gains of 4.7% this year and 2.5% in 2019.”
FIGURE 3: PENDING HOME SALES INDEX (MONTH OVER MONTH)
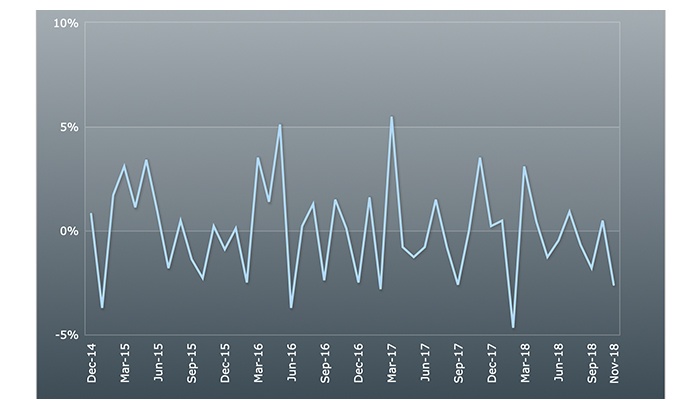
Source: Barron’s, The National Association of Realtors
The National Association of Home Builders released their quarterly Housing Trends Report in November, and this also contained a disappointing outlook for the housing market. Only 13% of their polled respondents in the third quarter of 2018 say they are prospective homebuyers (planning to buy a home within 12 months), versus a level of 24% at the end of 2017.
FIGURE 4: % PLANNING TO BUY A HOME WITHIN 12 MONTHS
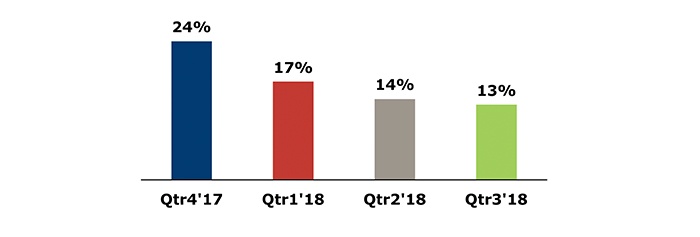
Source: National Association of Home Builders, November 2018
Not surprisingly, the shares of homebuilders have had a rough 2018, though the group has bounced off recent lows. Bespoke Investment Group noted last Friday (11/28),
“After hitting a 52-week high in the rally to kick off 2018, homebuilders have been a one-way street lower. The group made its initial low right in line with the broader market in late October, and when that rally failed, the group traded lower, but unlike the S&P 500, it never made a lower low. While the group didn’t participate in Friday’s rally, it did manage to make a higher high this week (w/o 11/26) and closed above its 50-DMA.”
FIGURE 5: S&P 1500 HOMEBUILDER INDEX (LAST 12 MONTHS)
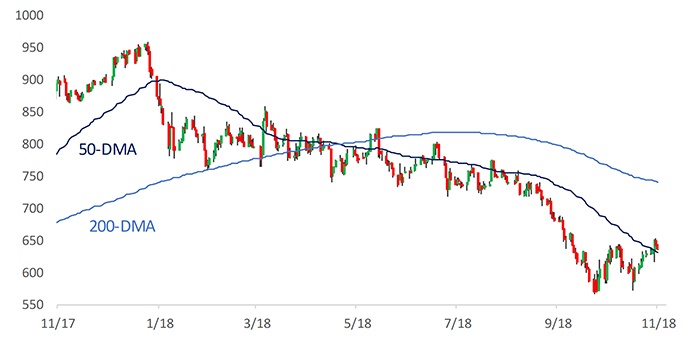
Source: Bespoke Investment Group