


We use “chandelier stops” for most of our trailing stops. We have been asked to explain how to calculate the chandelier stop, so here is the explanation. We use a 10-day period. That variable can be changed to suit your taste. The longer the period, the “looser” the trailing stop will be, as compared to the current underlying price. If you research this subject, you may see longer time periods (22 days, for example) being used.
The first thing that one does when computing the chandelier stop is to determine the highest price and lowest price that the underlying issue has traded at over the period (last 10 trading days, in our case). We will call these “Period High10” and “Period Low10.”
Average true range
Next, we need to determine the average true range (ATR). This is the component that determines the “volatility” of the underlying issue. This is not really volatility in the mathematical sense, but rather a measure of how wide the daily trading ranges are for this underlying issue—so it is a measure of volatility in that sense.
The true range of the underlying issue for a one-day period is not necessarily just the size of the trading range for that day. It also includes gaps as well as the distance from yesterday’s closing price.
True range high = maximum (yesterday’s close or today’s high)
True range low = minimum (yesterday’s close or today’s low)
True range = true range high – true range low
FIGURE 1: GRAPHIC MODEL FOR CALCULATING TRUE RANGE
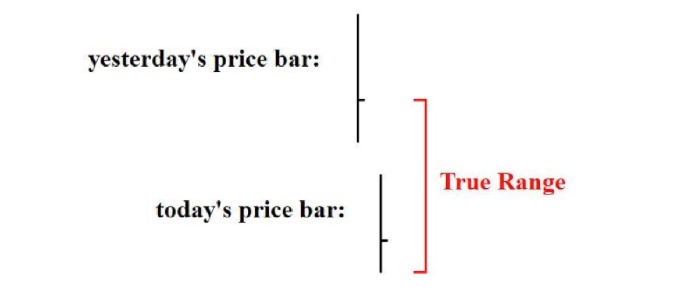
Source: optionstrategist.com
Figure 1 shows that the true range for a stock that gaps down is the distance from the previous day’s close to today’s low—that is much larger than the mere trading range for today alone.
The average true range (ATR) over any time period is the average of the daily ranges over that time period. Once again, we use 10 days, so our ATR is the average of the daily true ranges over the last 10 trading days. The notation for a 10-day average true range is ATR10.
Now we can calculate the chandelier stop. It is different, of course, for a buy stop or a sell stop.
Calculations:
- Chandelier sell stop (to exit a long position) = Period High10 – 3 X ATR10
One would exit a long position if the underlying issue closed below the chandelier sell stop. - Chandelier buy stop (to exit a short position) = Period Low10 – 3 X ATR10
One would exit a short position if the underlying issue closed above the chandelier buy stop.
If one draws the chandelier stops in this manner on a chart, one can see that the chandelier stop hugs the stock price in a trending environment. Therefore, it provides a good trailing stop, and if the underlying stock goes “parabolic,” the chandelier stop will follow it much more closely than, say, a mere 20-day moving average would.
Chandelier stop example
Some technicians feel that if one is using a chandelier sell stop, it should never be reduced in price (or a chandelier buy stop should never be raised). I mostly agree with this line of thinking. As an example, consider the chart of IBM in Figure 2. This is during the period in 2017 that we owned puts via the put-call ratio sell signal—that is, we had an options short position on IBM. The chandelier buy stop is the blue line that hovers above the price chart on the way down. Eventually, when IBM slowed its descent, the blue line rose, but most technicians would consider the stop to be what I have labeled as “min stop”—the minimum price that the chandelier buy stop had reached. The first one (labeled “1”) occurred in early May. Later, at point “2” the chandelier buy stop moved to lower levels, and the “min stop” was adjusted lower. Eventually, at point “3,” IBM finally closed above the “min stop” and the short sale or long put position was stopped out. Note that if one had not used the “min stop,” the short would still not have been stopped out because IBM had still not closed above the chandelier buy stop as of June 22—the last date on the chart.
There are other ways that one can use a volatility-based trailing stop (such as a “parabolic stop”), but I prefer the chandelier stop. I am a strong advocate of using trailing stops instead of targets. And while a moving average is a valid trailing stop, I feel the chandelier stop is better.
FIGURE 2: EXAMPLE OF IMPLEMENTING A CHANDELIER BUY STOP
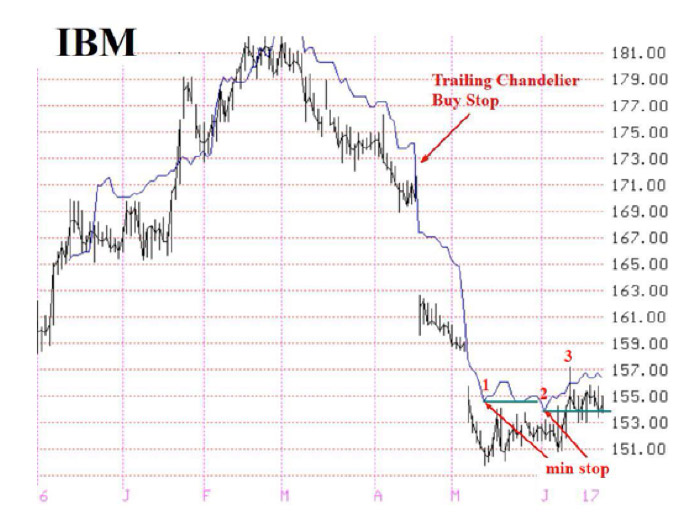
Source: optionstrategist.com
The opinions expressed in this article are those of the author and do not necessarily represent the views of Proactive Advisor Magazine. These opinions are presented for educational purposes only.
This article was first published on June 26, 2017, at optionstrategist.com.
 Professional trader Lawrence G. McMillan is perhaps best known as the author of “Options as a Strategic Investment,” the best-selling work on stock and index options strategies, which has sold over 350,000 copies. An active trader of his own account, he also manages option-oriented accounts for clients. As president of McMillan Analysis Corporation, he edits and does research for the firm’s newsletter publications. optionstrategist.com
Recent Posts: