

Investors over the past 15 years saw retirement dreams evaporate as two grizzly cyclical bear markets took the equity markets down more than 50%.
Today we would be better served focusing on bears to come and putting them in perspective. Not all bear markets are the same, and therefore each does not deserve the same degree of concern. So let’s look at history for a clearer perspective on cyclical bear markets.
Looking back over the past 66 years with 16 bear markets and corrections greater than 14%, two important criteria separate grizzly bear markets from teddy bears:
- Are we in a secular bull or secular bear market?
- Is the economy in a recession or “financial crisis”?
First step, determine what type of secular market we are in. The stock market by definition is either in a secular bull or a secular bear. Long periods of rising prices mark a secular bull (1949-1968, 1982-2000, 2011-?); a lengthy period with no progress or losses (1968-1982, 2000-2011) marks a secular bear.
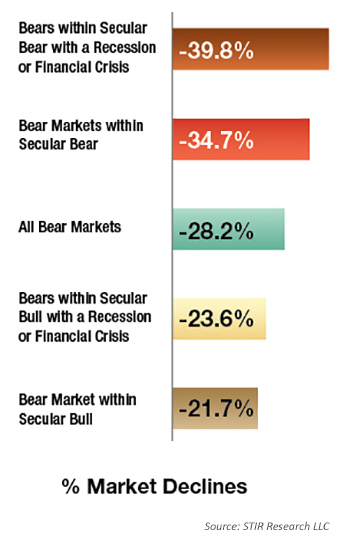 Within each secular cycle, investors will experience a number of cyclical bear and bull markets. By studying cyclical bear markets within the last two secular bears and the last two secular bulls we can see a significant difference: The average bear market within a secular bear is almost 60% rougher (-34.7%) than a bear market during a secular bull (-21.7% average)! Additionally, the pain of a cyclical bear within a secular bear has lasted over two times longer: 478 days versus only 207 days during a secular bull.
Another essential element in identifying the potential of a grizzly bear versus a teddy bear is whether the country is in a recession and/or financial crisis. Since 1949, the market has had 16 corrections or bear markets over 14% that were accompanied by 11 recessions/financial crises.
Interestingly, recession or financial crisis during secular bulls has had little effect on the decline in cyclical bears. In contrast, a recession or financial crisis in a secular bear takes the bear market to a 40% loss of capital and lasts much longer, 523 days on average—a grizzly bear.
Currently the economy is in a slow-growth mode, and over the past months legitimate concerns have surfaced over weaker economic data and a lower trajectory for corporate earnings. However, there is no firm indication that a recession is on the horizon.
In my book, “Dow 85,000! Aim Higher,” I make the argument that a new secular bull market is in progress and has the potential to produce 700% gains by 2030. It will be instructive to see if the current pullback in the markets falls into the teddy-bear camp (as I expect), or a full-blown grizzly.
That does not mean or imply that risk management needs to be forgotten. All risk-management defenses need to stay in place, in case history doesn’t repeat itself or what starts out as a teddy bear is suddenly surprised by a financial crisis (1987) and becomes a grizzly bear.
Risk management has two sides: protection of capital during the inevitable market declines and participating in major bull market moves. A bigger concern today may not be worrying about the next bear market but making sure you are fully participating in the current secular bull.
The opinions expressed in this article are those of the author and do not necessarily represent the views of Proactive Advisor Magazine. These opinions are presented for educational purposes only.
 Marshall Schield is the chief strategist for STIR Research LLC, a publisher of active allocation indexes and asset class/sector research for financial advisors and institutional investors. Mr. Schield has been an active strategist for four decades and his accomplishments have achieved national recognition from a variety of sources, including Barron's and Lipper Analytical Services. stirresearch.com