

The typically bullish end of Thanksgiving week for the stock market was anything but that this year.
MarketWatch noted,
“For the week, the NASDAQ tumbled 4.3%, the Dow ended the week 4.4% lower, while the S&P 500 notched a week-on-week decline of 3.8%. According to Dow Jones Market Data, this week’s performances for all three major indexes marks their worst Thanksgiving week since 2011.”
However, after the bounce-back rally in the first half of this week, the S&P 500 was comfortably above breakeven for the year—despite the declines of many of the biggest technology names.
That is a far cry from the ongoing weak price performance for certain key commodities.
Fox Business News reported earlier this week that the price of gasoline had fallen for 47 consecutive days in some areas.
And last Friday (11/23), crude oil prices slid 7.7%, suffering their largest one-day drop since 2015, according to The Wall Street Journal. The January 2019 futures price of a barrel of West Texas Intermediate Crude (WTI) was off more than 30% from the highs seen in October.
FIGURE 1: SIX-MONTH PRICE TREND FOR CRUDE OIL WTI JAN. 2019
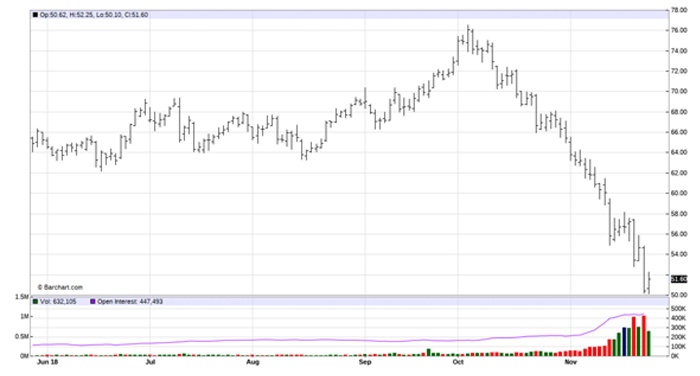
Source: Barchart.com. Data as of 11/26/18.
Perhaps more importantly, weakness in the price of copper has analysts concerned for what that might portend for global economic growth.
Bloomberg wrote in mid-November,
“The message of weakening demand on the oil front was reinforced by the falling price of copper. The base metal is often referred to as ‘Dr. Copper’ on its presumed ability to forecast the peaks and troughs of business cycles since it is used in different areas of the economy such as homes, factories and electrical generation. Copper has served as a leading indicator of both recessions and economic booms. …
“Weaker commodity prices are a result of two related factors. Economies other than the U.S. have lost the vibrancy they exhibited in 2017. … Lower commodity prices are also a response to the dollar’s relentless march upward as the Federal Reserve increased interest rates eight times since December 2015.”
FIGURE 2: COMEX COPPER PRICE OVER PAST SIX MONTHS
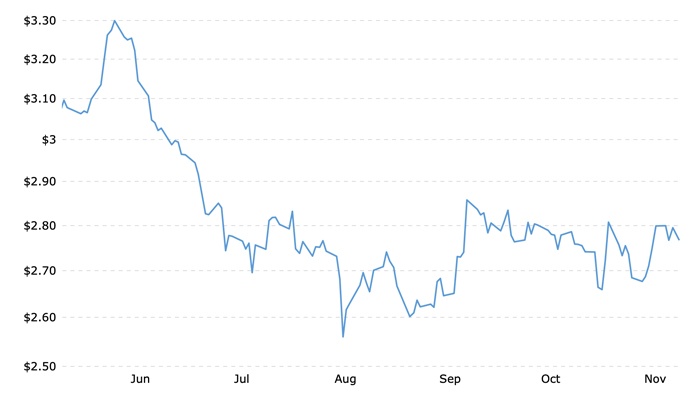
Note: COMEX copper price shown is in U.S. dollars per pound.
Source: Macrotrends.net. Data as of 11/26/18.
The International Monetary Fund (IMF) reinforced the theme of slowing growth in their October 2018 World Economic Outlook.
Their report was prefaced with the statement,
“The steady expansion underway since mid-2016 continues, with global growth for 2018–19 projected to remain at its 2017 level. At the same time, however, the expansion has become less balanced and may have peaked in some major economies. Downside risks to global growth have risen in the past six months and the potential for upside surprises has receded.”