

Copper prices had rallied to recent highs in 2017 and early 2018, reflecting optimism over U.S., China, and other nations’ growth prospects for 2018.
An article at Nasdaq.com said in late January 2018,
“Industrial metal ETFs have been in the spotlight lately and copper prices have been rallying to record highs. Strong global economic growth is driving demand for the red metal. Per the IMF’s (International Monetary Fund) latest report, global economic growth is expected to hit 3.9% in 2018. Copper is widely used in construction as well as manufacturing activities. Therefore, strong price trends for copper supports market sentiments of robust economic growth.”
However, the past few months of tensions over tariffs and “trade wars” have been one factor that may contribute to somewhat lower expectations for global growth going forward. To the degree that copper is a leading global economic indicator, this has already shown up in the recent prices for the metal, which have plunged to a one-year low.
FIGURE 1: JULY FUTURES CONTRACT FOR HIGH-GRADE COPPER
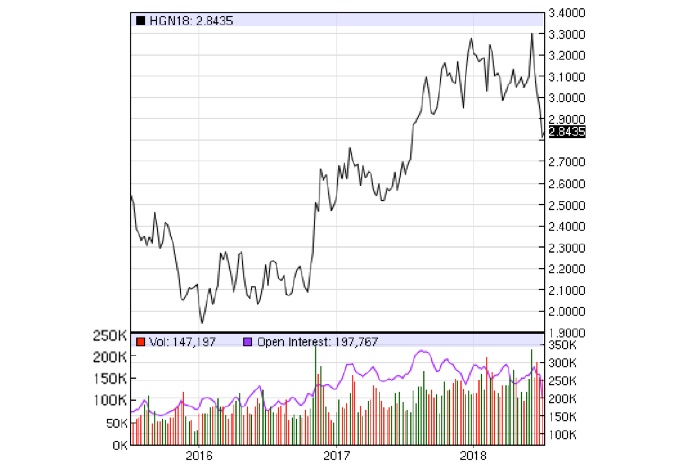
Note: July contract, according to the CME Group, is priced in U.S. cents per pound, with a contract unit of 25,000 pounds.
Source: Nasdaq.com, data as of 7/9/18.
Reuters commented on recent copper prices on Monday (July 9), saying in part,
“‘Trade rhetoric from the U.S. administration continues to upset risk sentiment and this has been reflected in the downward trend in copper prices in June and early July,’ analysts at Wood Mackenzie said. …
“The United States and China exchanged the first salvos in what could become a protracted trade war on Friday, slapping tariffs on $34 billion worth of each other’s goods and giving no sign of willingness to start talks aimed at a reaching a truce.
“Recent data from China show growth may be slowing due to tighter credit conditions and softer domestic demand ranging from government-funded infrastructure investment to consumer spending. Global copper consumption is estimated at around 24 million tons this year, with China accounting for about half of that.”
Given that, according to the CME Group, “copper prices are sensitive to cyclical industries, such as construction and industrial machinery manufacturing,” the metal has earned the nickname “Dr. Copper” from some traders and analysts for its ability to predict changes in economic trends.
Says Investopedia,
“The term Doctor Copper is market lingo for the base metal that is reputed to have a Ph.D. in economics because of its ability to predict turning points in the global economy. Because of copper’s widespread applications in most sectors of the economy—from homes and factories to electronics and power generation and transmission—demand for copper is often viewed as a reliable leading indicator of economic health. This demand is reflected in the market price of copper. Generally, rising copper prices suggest strong copper demand and, hence, a growing global economy, while declining copper prices may indicate sluggish demand and an imminent economic slowdown. …
“A study by the Dutch bank ABN AMRO published in 2014 examined the correlation between copper prices and a number of measures of global economic activity. The statistical analysis shows a strong correlation between copper prices and world trade, regional GDP growth in China, the U.S. and EU, as well as oil and gold prices.”
It will be interesting to see if the IMF revises global growth projections in its next World Economic Outlook, scheduled for release on July 16, 2018. In June, the IMF posted on its blog, “The world economy continues to show broad-based momentum. Against that positive backdrop, the prospect of a similarly broad-based conflict over trade presents a jarring picture.”
TABLE 1: IMF WORLD ECONOMIC OUTLOOK GDP PROJECTIONS (APRIL 2018)
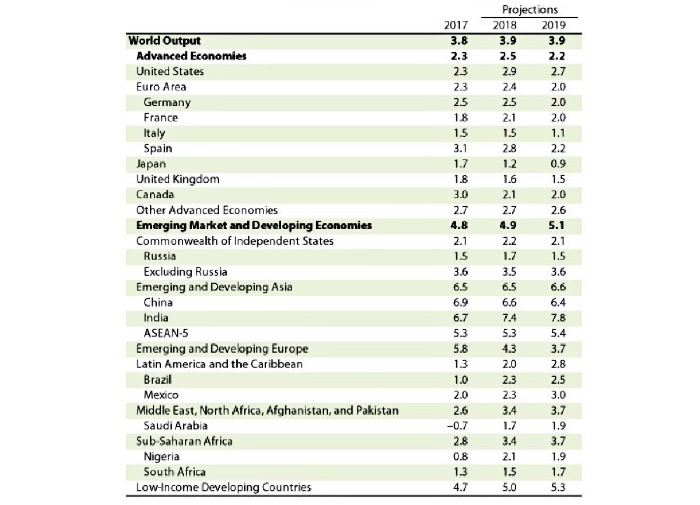
Source: International Monetary Fund, April 2018