

Despite the Fed’s announcement of a quarter-point cut in interest rates on July 31, the markets have responded in a volatile fashion over the past two weeks.
The market’s performance—a loss close to 4% for the S&P 500 from July 26 through Aug. 9—is being blamed on several factors:
- Ongoing trade tensions, especially between the U.S. and China; the direct threat of new tariffs by the U.S.; and uncertainty regarding China’s possible actions in response.
- Disappointment over the magnitude of the Fed’s cut and comments from Fed Chairman Powell that did not directly support the idea of further rate cuts.
- Fears of a continuing slowdown in global growth.
- Q2 corporate earnings that are estimated to show a decline close to 1% from last year, despite beating lowered expectations in many cases.
The lack of real progress in the trade negotiations with China, coupled with generally weaker economic data around the world, has taken a toll on the price of several key commodities while contributing to gold’s gain.
The Wall Street Journal wrote on Aug. 3,
“Copper, considered a bellwether for global growth, lost 3.9% for the week … a sign of how the Federal Reserve’s rate cut this week failed to alleviate worries about global growth. …
“Manufacturing, a major consumer of metals, is flagging throughout the world’s major economies. Purchasing managers’ indexes published this week showed that factory activity shrank in China, the Eurozone and U.K. in July.”
In the U.S., says GoldPrice.Org, “the ISM manufacturing index hit the lowest point since August 2016 in July, dropping to 51.2 vs. 52 expected. Factory activity has now seen four straight months of downturn and is nearing contraction. … A separate factory index from IHS Markit came in at 50.4 for July, the lowest point in almost ten years.”
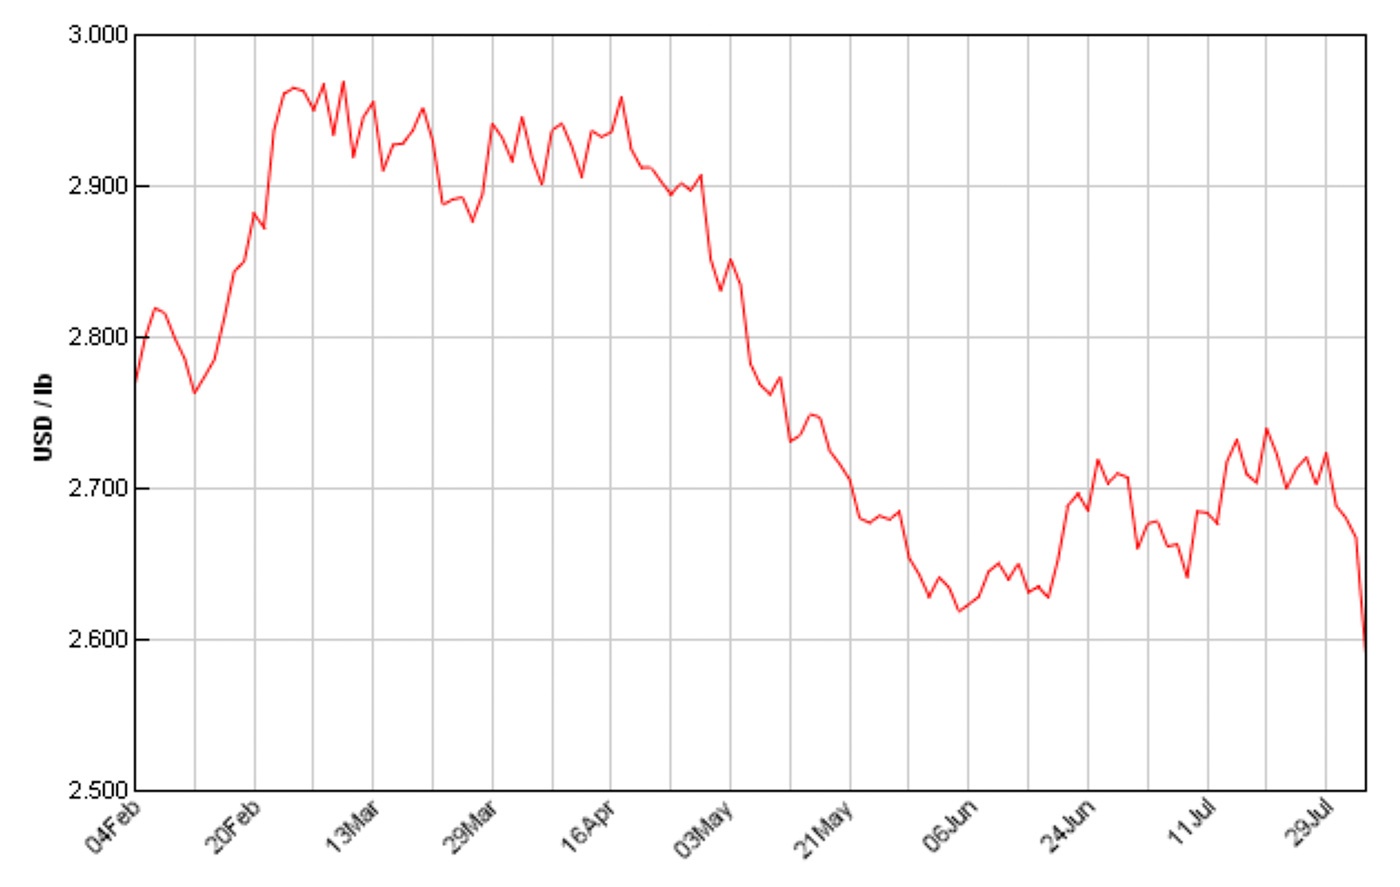
Source: Kitco.com
Natural gas is another commodity that has been showing significant weakness in 2019, though the reasons have much to do with an abundant supply, rather than solely slowing global growth. According to The Wall Street Journal, prices for natural gas are down 28% for the year, which is affecting the earnings for global energy firms.
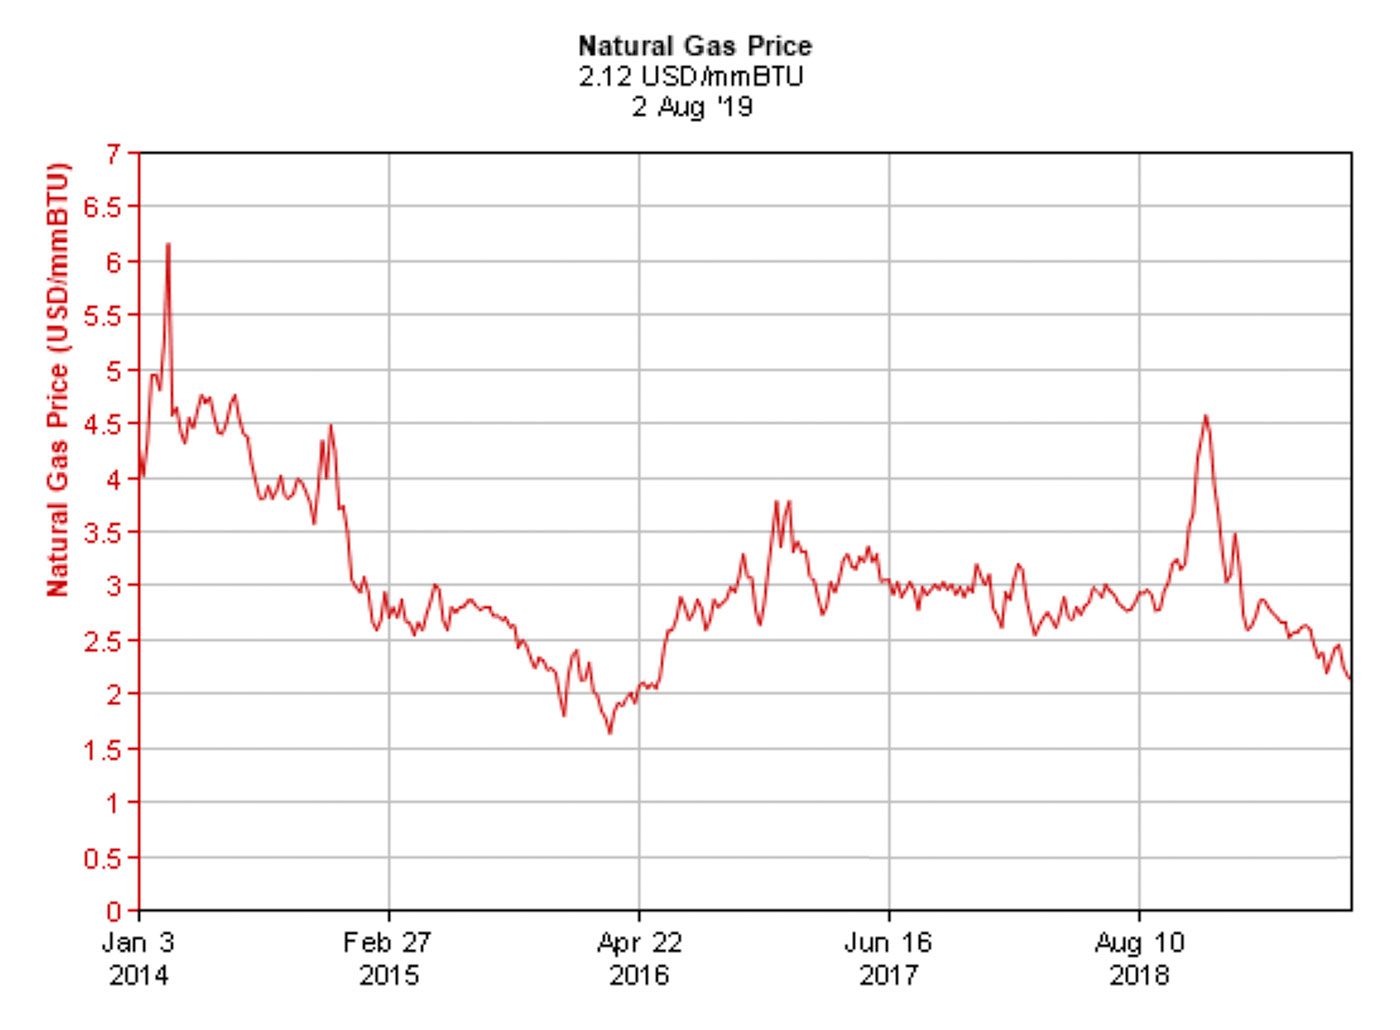
Source: InfoMine.com
While crude oil prices are still up significantly for the year, they have dropped about 16% since April.
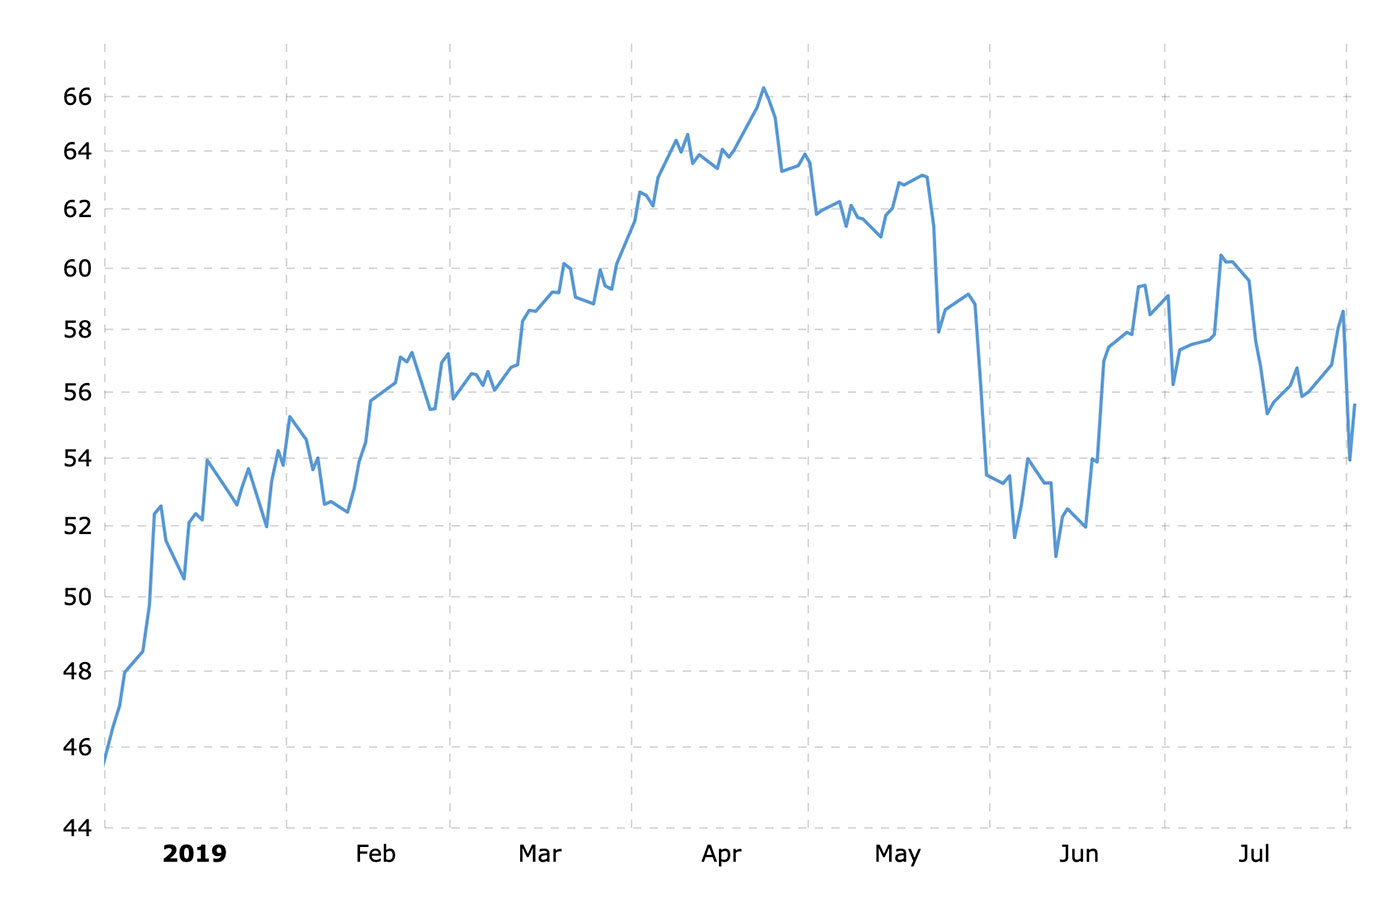
Source: Macrotrends
Gold, however, is rallying—trading in the opposite direction of copper, natural gas, and crude oil.
Reuters wrote on Aug. 5,
“Gold surged 2% on Monday to its highest level in more than six years as a worsening U.S.-China trade conflict prompted investors to dump riskier assets for safe havens, with a weaker dollar lending further fuel for bullion’s run. …
“‘What is driving gold is fear of these tariffs and the fear of China retaliating,’ said Michael Matousek, head trader at U.S. Global Investors, adding that a host of uncertainties surrounding the global economy, an environment of negative bond yields, and an ongoing currency war were making the case for gold. ‘Gold is in a bull market and is going to trend higher. This is just a start of another wave going up.’”
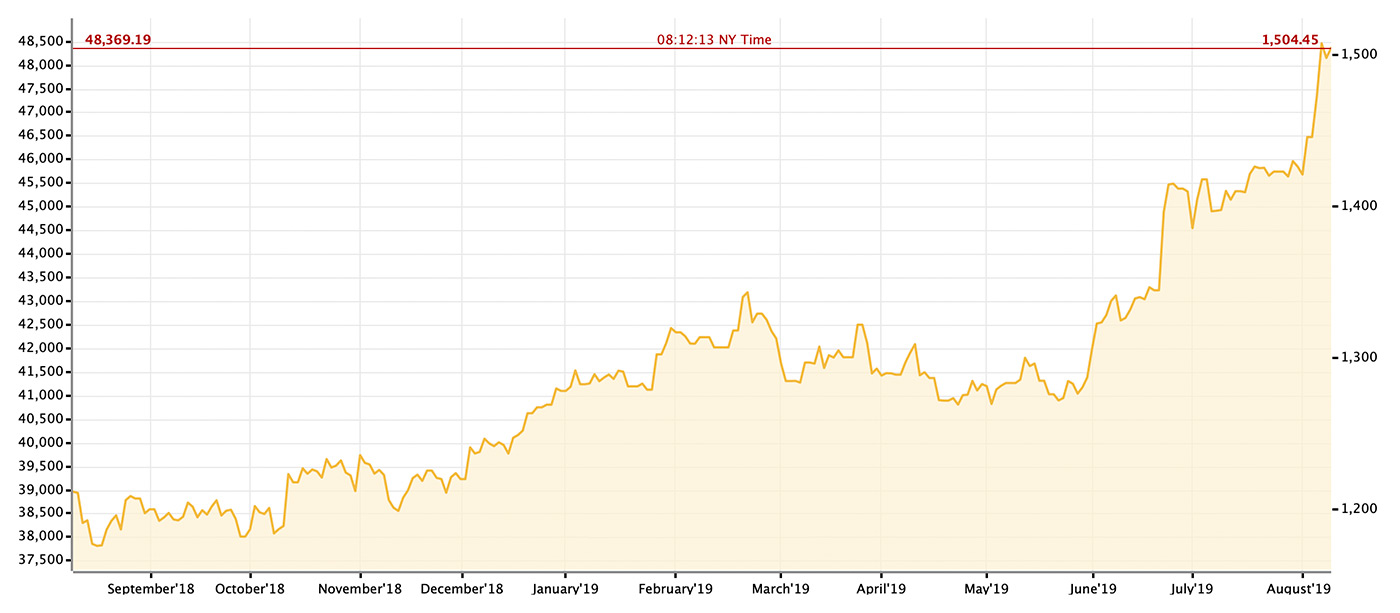
Source: GoldPrice.Org
FactSet’s earning projections have the Materials sector showing by far the worst performance of all sectors for Q2 2019.
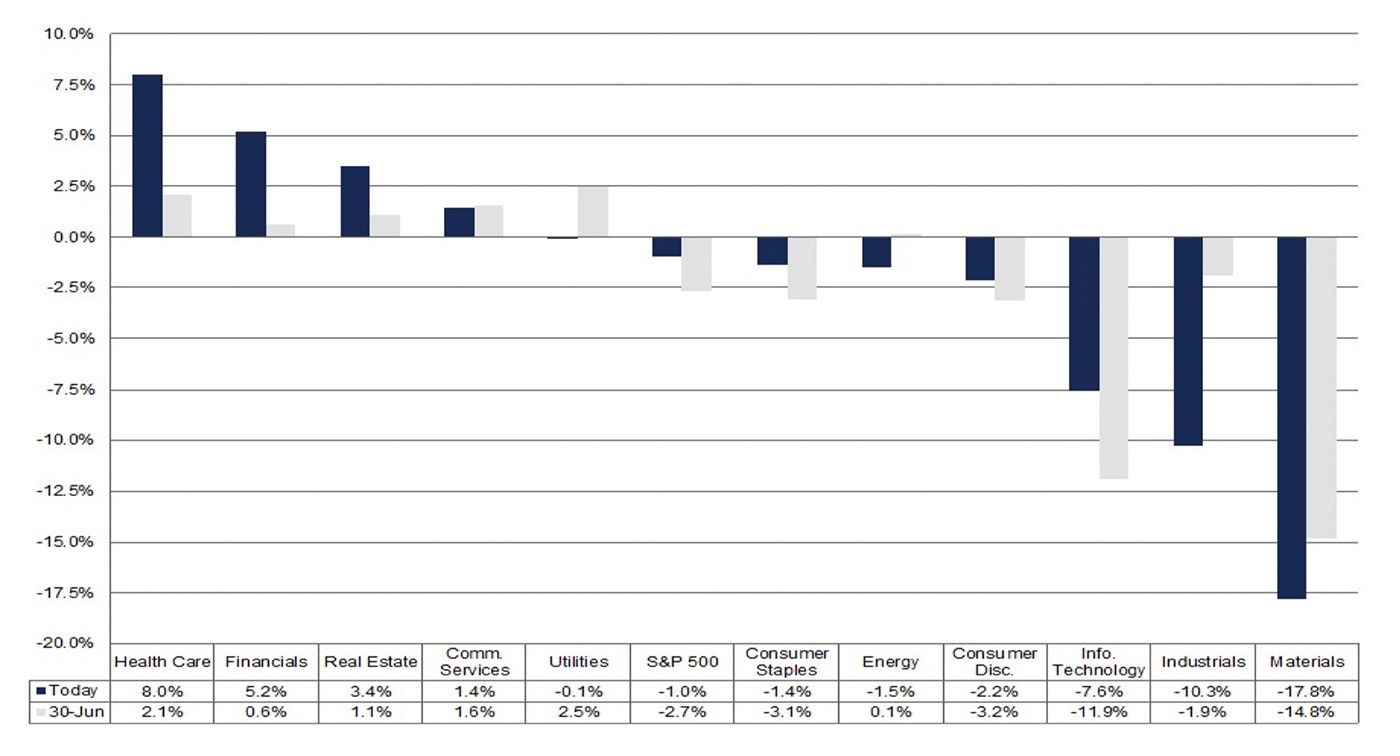
Source: FactSet