

I have previously discussed some of the volatility-based indicators that can help identify a market bottom. For most of this year, volatility has been subdued, and there hasn’t been any real use for these indicators. But now that Greece, Puerto Rico, China, and other factors have combined to put some fear into the market, there are some potentially attractive situations beginning to develop.
The first one is a spike peak buy signal in the CBOE’s Volatility Index ($VIX). Even though the composition of this indicator has changed over the years, there remains one constant: When $VIX spikes up and then spikes sharply back down again, a broad market buy signal is generated.
The big rise in $VIX on Monday, June 29, placed it in a “spiking mode.” $VIX entered into a spiking mode when it rose 4.83 points that day. The highest intraday high that it made while in “spiking mode” was 19.80 on Tuesday, June 30. Once $VIX closed more than 3.00 points below the highest intraday high (since June 29), a buy signal was generated for the S&P 500 Index ($SPX). That buy signal occurred on Wednesday, July 1, when $VIX closed at 16.29.
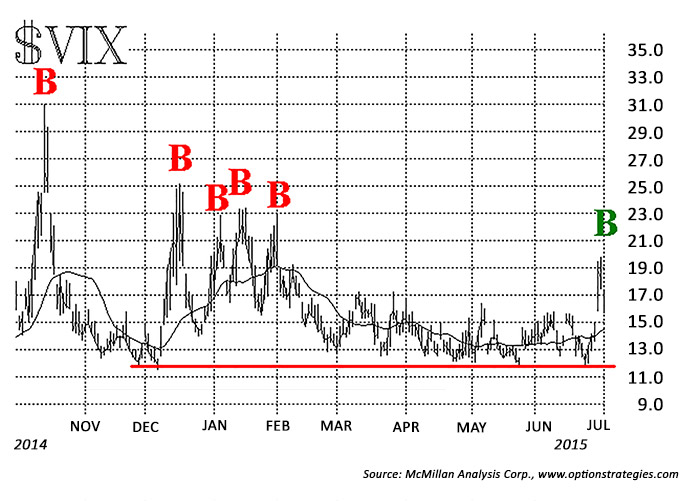
The buy signal remains in effect for 22 trading days, or until $VIX closes above the previous intraday high of 19.80 (the stop-out level), whichever comes first.
The chart shows $VIX since last October. The $VIX spike peak buy signals that have occurred over that time period were quite successful, but there hasn’t been one since several occurred this past January.
Assessing the volatility term structure
Another thing to watch is the relationship of the four CBOE volatility indexes:
$VXST—the short-term volatility Index (measures a 9-day volatility).
$VIX—measures a 30-day volatility.
$VXV—measures a 93-day volatility.
$VXMT—the mid-term volatility index (measures a 6-month volatility).
In a benign, rising, bullish market, they will line up from low to high (i.e., they will display a positive slope):
$VXST < $VIX < $VXV < $VXMT
However, when the market sold off sharply on June 29, that relationship changed. At the end of the day on June 29, they had this relationship:
$VXST > $VIX > $VXV < $VXMT
So, except for the last one, the relationship had completely inverted. That is bearish while it exists, and one should be wary of buying the market “for a trade” when this setup is in place. However, it is an oversold condition, and when $VIX falls back below $VXV on a closing basis, a strong broad-market buy signal occurs. That buy signal occurred on June 30, and was confirmed more strongly on July 1.
When this buy signal occurs, the market is usually in a highly volatile mode. The signal is swift and makes its best gains in the first five days of trading. Three of the previous signals of this type produced successful buys where the $SPX rapidly rose about 40-65 points in two days. Since the $VXV Index was introduced (2008), this system has produced 60% winners. Since the end of 2012 (i.e., in the strongest phase of this bull market), it has shown 75% winners. A signal would be stopped out if $VIX closed above $VXV, but, of course, that would just be a setup for another buy signal.
So, now that volatility has finally spiked, two buy signals have been given. If volatility remains high during the coming months, signals such as these should become more frequent. But remember, just because the market is oversold (i.e., just because $VIX is spiking), that alone is not a buy signal. These conditions of rising volatility can last for some time, and one should wait for confirmed buy signals before buying the market.
The opinions expressed in this article are those of the author and do not necessarily represent the views of Proactive Advisor Magazine. These opinions are presented for educational purposes only.
 Professional trader Lawrence G. McMillan is perhaps best known as the author of “Options as a Strategic Investment,” the best-selling work on stock and index options strategies, which has sold over 350,000 copies. An active trader of his own account, he also manages option-oriented accounts for clients. As president of McMillan Analysis Corporation, he edits and does research for the firm’s newsletter publications. optionstrategist.com