

The number of volatility derivatives has grown dramatically since the first volatility futures were listed on CBOE’s Volatility Index ($VIX) in 2004. Anyone interested in market trends should pay attention to the pricing structures and patterns of these derivatives.
Here are a few simple things to watch. The first is the pattern of $VIX itself. A very reliable indicator is the $VIX spike peak market buy signal. The rules for a $VIX spike peak buy signal are not complicated:
-
- $VIX must be “spiking.” $VIX is considered to be “spiking” if it has risen by at least 3.00 points over a three-day period, measured using closing prices. Once $VIX is spiking, it remains in “spiking” mode until a buy signal occurs, regardless of whether or not $VIX keeps rising as fast. Keep track of the highest intraday price that $VIX reaches while in “spiking” mode.
- Once $VIX is “spiking,” a buy signal will occur when $VIX closes at least 3.00 points below the highest intraday price that $VIX attained while it was “spiking.”
- The buy signal remains in force for a month or until $VIX closes above that previous intraday peak (this is the “stop” for the system).
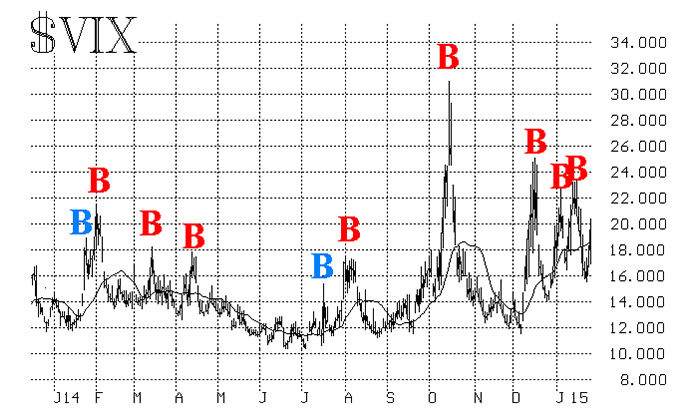
The following figure shows the $VIX spike peak buy signals over the past year. Those marked in red were successful, while those shown in blue were not. In each successful case, the S&P 500 Index ($SPX) rose substantially, even if not for the entire approximate monthlong period.
Astute observers will note that, at the far right of the figure, $VIX is again spiking (1/29), so a new buy signal may be generated shortly.
Assessing the volatility term structure
Another simple approach can provide insight as to what volatility traders feel about forthcoming market volatility, or about the trend of the broad stock market. In order to glean this information, one can observe the relationships of the four CBOE Volatility Indexes:
$VXST: the short-term-volatility index (measures a nine-day volatility);
$VIX: measures a 30-day volatility;
$VXV: measures a 90-day volatility;
$VXMT: the mid-term-volatility index (measures a six-month volatility)
In a benign, rising market they will line up from low to high (i.e., they will display a positive slope): $VXST < $VIX < $VXV < $VXMT.
However, when things begin to get dicey, the relationship of these indexes can prove useful.
A. If $VXST crosses above $VIX, expect the market to be (much) more volatile over the ensuing three weeks, even if $VXST doesn’t necessarily remain above $VIX for the entire three weeks. But if $VXST repeatedly remains above $VIX, expect the market to constantly exhibit high volatility.
B. $VIX crossing above $VXV is a major warning sign, and the market is expected to drop. This bearish signal remains in effect until $VIX once again crosses below $VXV—and that crossover issues a buy signal for the short term.
C. Finally, if the entire term structure inverts, to the point where $VXST > $VIX > $VXV > $VXMT, then a true bear market environment exists, and one should act accordingly until the term structure flattens and eventually returns to a positive slope.
With these rules and observations, one is able to gain an insight as to what volatility has in store for the broad stock market.
The opinions expressed in this article are those of the author and do not necessarily represent the views of Proactive Advisor Magazine. These opinions are presented for educational purposes only.
 Professional trader Lawrence G. McMillan is perhaps best known as the author of “Options as a Strategic Investment,” the best-selling work on stock and index options strategies, which has sold over 350,000 copies. An active trader of his own account, he also manages option-oriented accounts for clients. As president of McMillan Analysis Corporation, he edits and does research for the firm’s newsletter publications. optionstrategist.com
Recent Posts: