


The ABCs of technical analysis
Technical analysis is the only investment methodology I know of that has one hard-and-fast rule: If a market is at point A and it is headed to point C, and B is somewhere in between, then it will have to pass through B on its way to C.
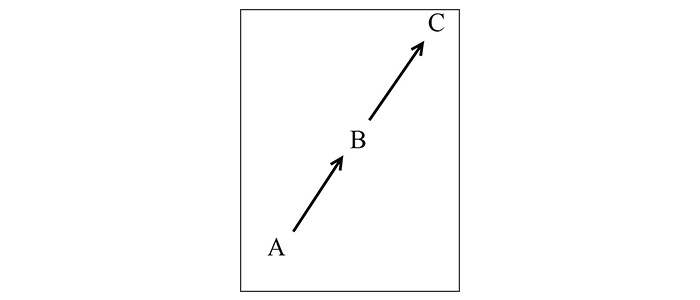
Now, it’s not always as easy as just “buying at B,” but you’ll do much better attempting to trade with the trend somewhere around B than fighting the trend—or worse, trying to interject some sort of fundamentals, valuations, or other reasoning into your trades.
On the flip side, if a market makes it to C and then begins to have a round trip back to A, it will have to pass through B on its way back down to A.
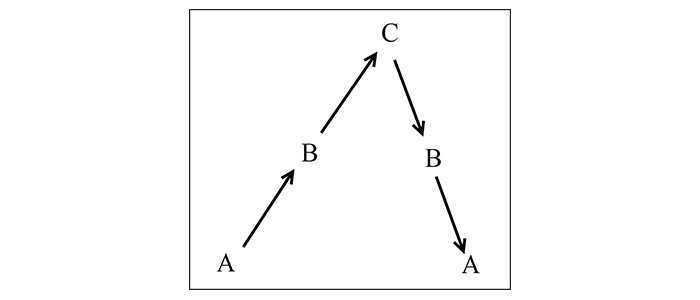
If a market is to go beyond C, then it will start by approaching C.
Considering this premise, why not stay invested as long as a market stays near C and then exit (or possibly even take a short position) if it begins to fall back to B?
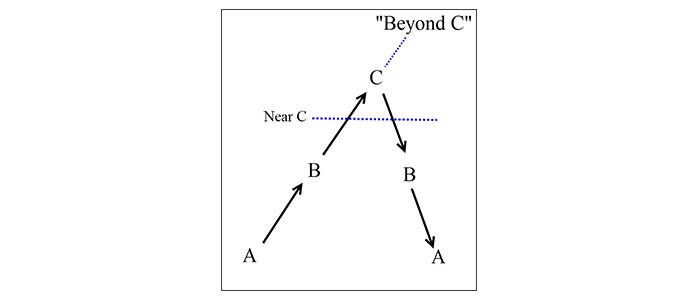
Now, before we develop a system, we need to do decide exactly what “near C” is. Although it is somewhat arbitrary, I figure that as long as the market (based on the S&P 500) is within 10% of its 50-week high, then it is healthy and has the chance to go to C and beyond. Conversely, if a market is further than 10% away from its 50-week high, then it could be in trouble, or at the least, it isn’t acting very healthy.
Like death and taxes, there will always be ‘whipsaws’
With any trading or investment methodology, whipsaws (acting on a signal that does not pan out) are simply a fact of life. You never really know if a sell-off is simply a correction in a longer-term trend or if it’s the “big one.”
Technical analyst Greg Morris perhaps said it the best, “Whipsaws are frustrating. Bear markets are devastating. You can survive frustration.”
To reduce upside whipsaws (premature buys), I added the rule that to go long in a market, the market must not only be near C (less than 10% away from its 50-week high), but it must also have two lows above its 50-week moving average. This is known as upside “daylight.” (See my article for more detail on this concept, which I also call “Davelight.”) This simple rule helps to ensure that the market is trending in the right direction.
To avoid whipsaws on the downside (premature exits), the only requisite is that the market has to close below its 50-week moving average. I don’t require downside daylight since markets “slide faster than they glide.”
In other words, I don’t want to wait until the market is already in a serious sell-off. By then it might be too late. In markets, you often want to sell first and ask questions later. The old hedge fund adage “he who fights and runs away, lives to fight another day” comes to mind.
Case in point: In 1987, the market dropped below 10% of its 50-week high and closed below the 50-week moving average on the week ending Oct. 16, 1987. There wasn’t downside daylight until the following Monday. By then, the market had already dropped an additional 34%.
FIGURE 1: OCTOBER 1987 MARKET CRASH
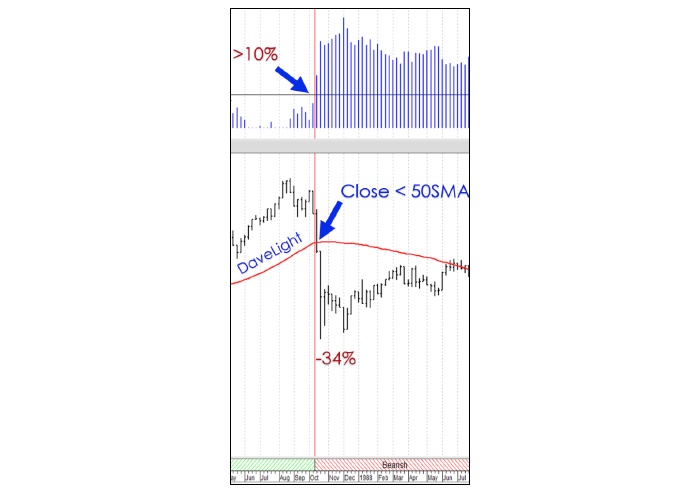
Note: In the upper chart, readings above or below the blue line show how far the market is from its 50-week high. Readings above the blue line are bearish, indicating the market is more than 10% from its 50-week high.
Source: davelandry.com
The system defined
A market is considered bullish as long as it is within 10% of its 50-week high and its lows (two or more) are greater than its 50-week moving average. Conversely, a market is considered bearish as long as it is 10% or more away from its 50-week high and it closes below its 50-week moving average. So, in general, you want to be invested as long as the market is “bullish,” and you want to be out of the market (or possibly even short) as long as the market is “bearish.”
Here are the rules:
- Buy a market when there are two weekly lows above the 50-week moving average and the market is less than 10% away from its 50-week high.
- Exit the market when it is greater than 10% away from its 50-week high and it closes below its 50-week moving average.
I have resisted the temptation to add additional rules for fear of making a simple system complex, and, more importantly, I wanted to avoid fitting the curve to the data.
Now, before we get into the observations, keep in mind that my goal was not to create a strict mechanical system but rather a simple tool to help me to “err on the side of the longer-term trend” and to help me get out of the way during bear markets.
Observations
This simple system does a good job of keeping you in long-term secular bull markets and keeping you out of bear markets. In the following figure, notice that it stayed bullish (or, at worst, neutral) for nearly a decade during the great bull run of the 1990s.
FIGURE 2: BULL MARKET OF THE 1990S
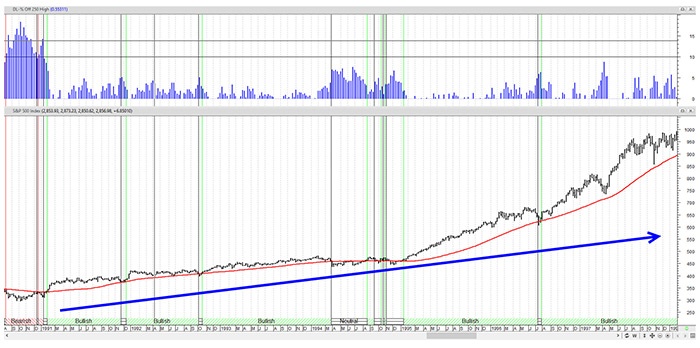
Source: davelandry.com
The good news is that this system would have gotten you out of every bear market fairly quickly.
If you think about it, if a market is going to lose half of its value or more, it’s going to pass through “B”—losing 10% first. Looking back at the past two bear markets, there were sell signals in October 2000 and January 2008. The market subsequently dropped over 43% and 52%, respectively, before recovering.
Notice in Figure 3 that the system stayed bearish (or, at worst, neutral—no buy signals) throughout the last two bear markets and bullish (or, at worst, neutral—no sell signals) during the bull market in between.
FIGURE 3: SYSTEM AT WORK IN BEAR AND BULL MARKETS
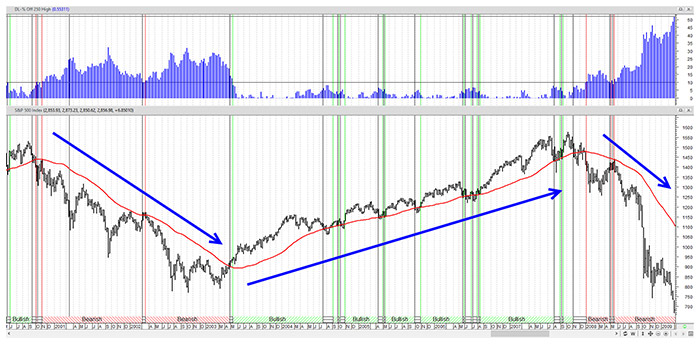
Source: davelandry.com
If you go way back, in 1929 the market dropped over 83% after the exit (Oct. 25, 1929). Obviously, there are no guarantees when it comes to markets, but as you can see, something as simple as this can help to keep you on the right side.
Where are we now?
The last sell signal was in January 2016 (after staying bullish for the three years prior). This signal turned out to be just a whipsaw, but that’s OK. Sometimes, it’s better to get out of the way and then ask questions later.
This reminds me of a quote from Jud Doherty, president of Stadion Money Management LLC, as found in Greg Morris’ book “Investing with the Trend.”
“Active management has underperformed since the lows of 2009, but this is to be expected. Anyone who has kept pace with the market the last few years should be questioned, because they likely have not made any moves that would (or will) protect their portfolio when the next inevitable bear market occurs.”
For now, we remain in an obvious bullish trend.
FIGURE 4: CURRENT S&P 500 TREND
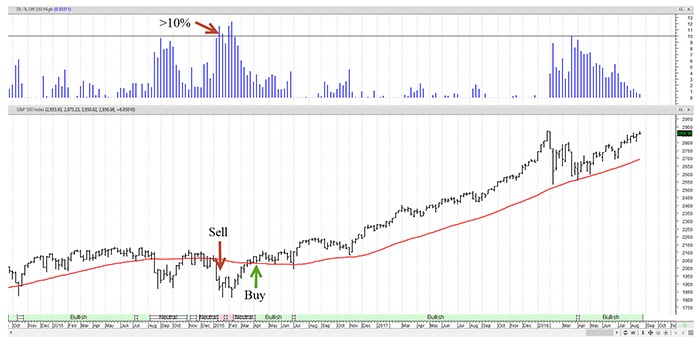
Source: davelandry.com
Technical analysis has the word “technical” in it, but it doesn’t have to be mind-numbingly technical. Staying on the right side of the trend is often as easy as ABC.
The opinions expressed in this article are those of the author and do not necessarily represent the views of Proactive Advisor Magazine. These opinions are presented for educational purposes only.
Charts created with MetaStock. Dave Landry’s indicators such as “DaveLight” are available for free with MetaStock at http://www.metastock.com/davidlandry.
 Dave Landry has been trading the markets since the early 1990s and is the author of three books on trading. He founded Sentive Trading LLC in 1995 and since then has been providing ongoing consulting and education on market technicals. He is a member of the American Association of Professional Technical Analysts and was a registered Commodity Trading Advisor (CTA) from 1995 to 2009. davelandry.com
Recent Posts: