
The small investor is not ‘always wrong’
The small investor is not ‘always wrong’

Retail investors can be spectacularly wrong at major market turning points, but we’ve found that they aren’t always wrong at their sentiment extremes. We prefer to assess the potential impact of retail investor sentiment extremes by combining those sentiment extremes with a trend indicator—enhancing the effectiveness of this as an indicator for market turning points.
Markets behave rationally most of the time. But at various points in the market cycle, irrational behavior can lead to extremes. The market is like the typical human being this way: logical and grounded most of the time but occasionally way out of bounds.
For investors, these periods of market irrationality are the most dangerous times of all because it only takes one major mistake to undo years of hard-fought portfolio gains. These challenging periods are often described with terms such as capitulation or irrational exuberance, and they often end up representing major market bottoms or tops.
In the parlance of behavioral finance, the biases most often associated with extreme crowd behaviors are groupthink and the bandwagon effect. (Academia also refers to this as herd behavior). Groupthink is exactly what you would expect. It’s the tendency of people in a group to all end up thinking the same way. Most psychologists attribute groupthink to the individual’s strong need to be accepted by the group. It’s essentially a form of peer pressure.
The bandwagon effect is a form of groupthink, but it’s more commonly associated with longer-term trends. When a trend takes hold and starts to really defy expectations, everyone eventually feels like they must get on the bandwagon or risk losing the acceptance of their peers.
It’s not difficult to understand how groupthink and the bandwagon effect can and do lead to dramatic market dislocations as a majority of investors all crowd over to one side of the boat. And then they all start running back to the other side of the boat when the boat starts to tip over.
But markets, being anticipatory systems (i.e., a system in which participants seek an advantage by anticipating future states of the system), are subject to second- and third-order effects from known behavioral biases. In short, it’s become conventional thinking that markets are regularly subject to the madness of crowds. Groupthink has become groupthink!
With so many market participants trying to anticipate when exactly the crowds are likely to all jump on one big bandwagon, it’s more important than ever to have indicators that forecast when extreme moves in price are likely to be associated with sharp reversals. We have found that combining indicators based on volatility, trend, and small-investor sentiment can shed light on when to bet against the crowd and when to bet with the crowd.
Note that our system was developed using proprietary measures of volatility, trend, and sentiment, but a similar approach can be developed using readily available indicators like Bollinger bands, 200-day SMAs (simple moving averages), and small-investor sentiment and commitments of traders data.
Here’s how it works on the S&P 500.
At the heart of the system is a proprietary trend indicator. It’s the green line on the chart of the S&P 500 in Figure 1. The blue line above the green line represents a critical threshold where price has moved above the trend line by a significant amount (typically about two standard deviations).
When we see price reach such a bullish extreme we also check to see if our sentiment indicator is at a bullish extreme. We define a bullish sentiment extreme as rising above 60% bullishness.
When we see both price and sentiment simultaneously stretched to bullish extremes, we expect a significant reversal where price falls back toward (and often to) the supporting trend line. You can see three examples in Figure 1.
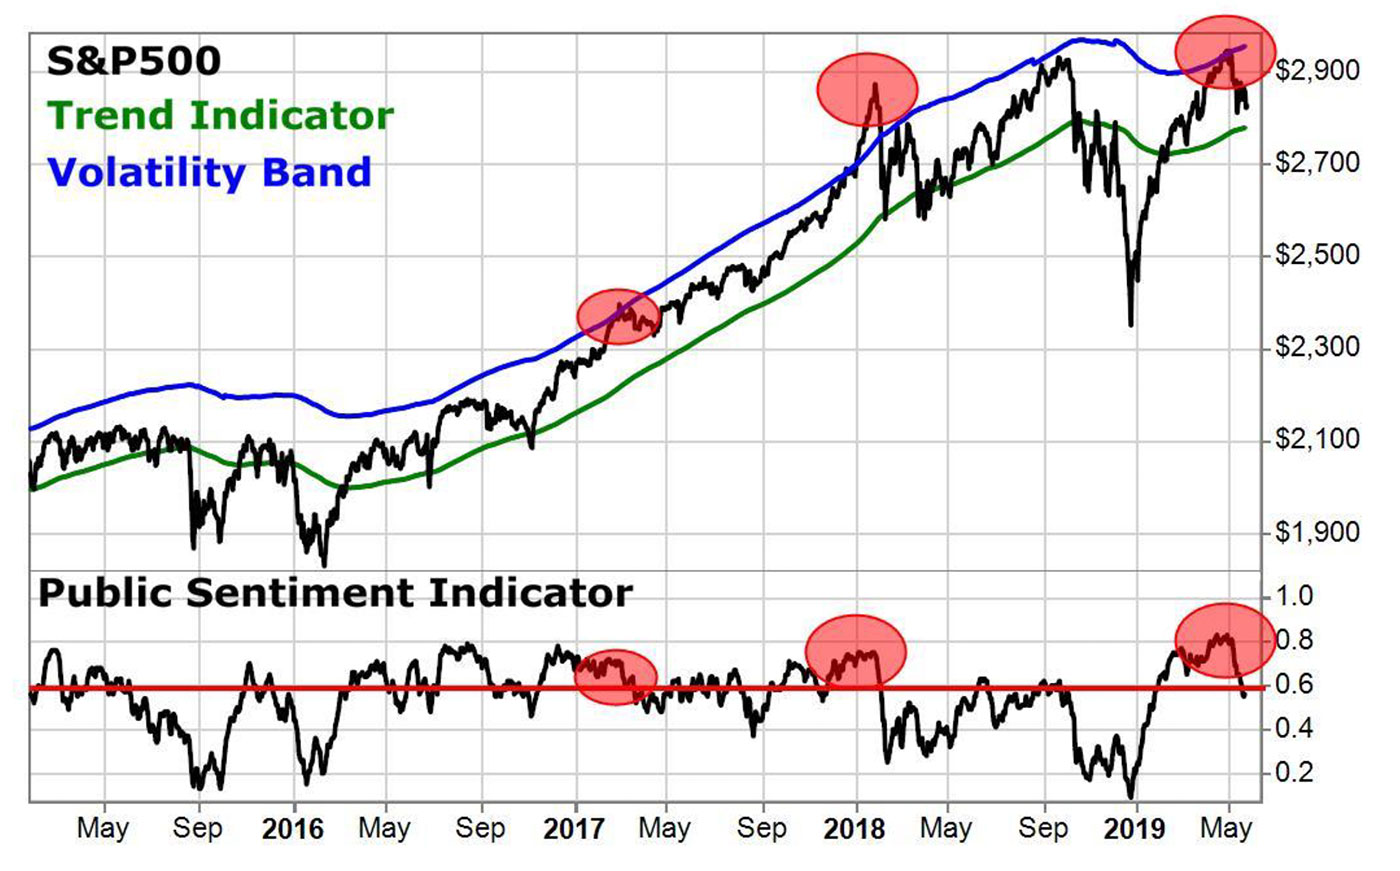
Source: Dr. Richard Smith
The indicator works very similarly when price is extended away from the trend to the downside and public investor sentiment is on the bearish end of the spectrum (less than 40% bullish). You can see three such instances in the past four years in Figure 2.
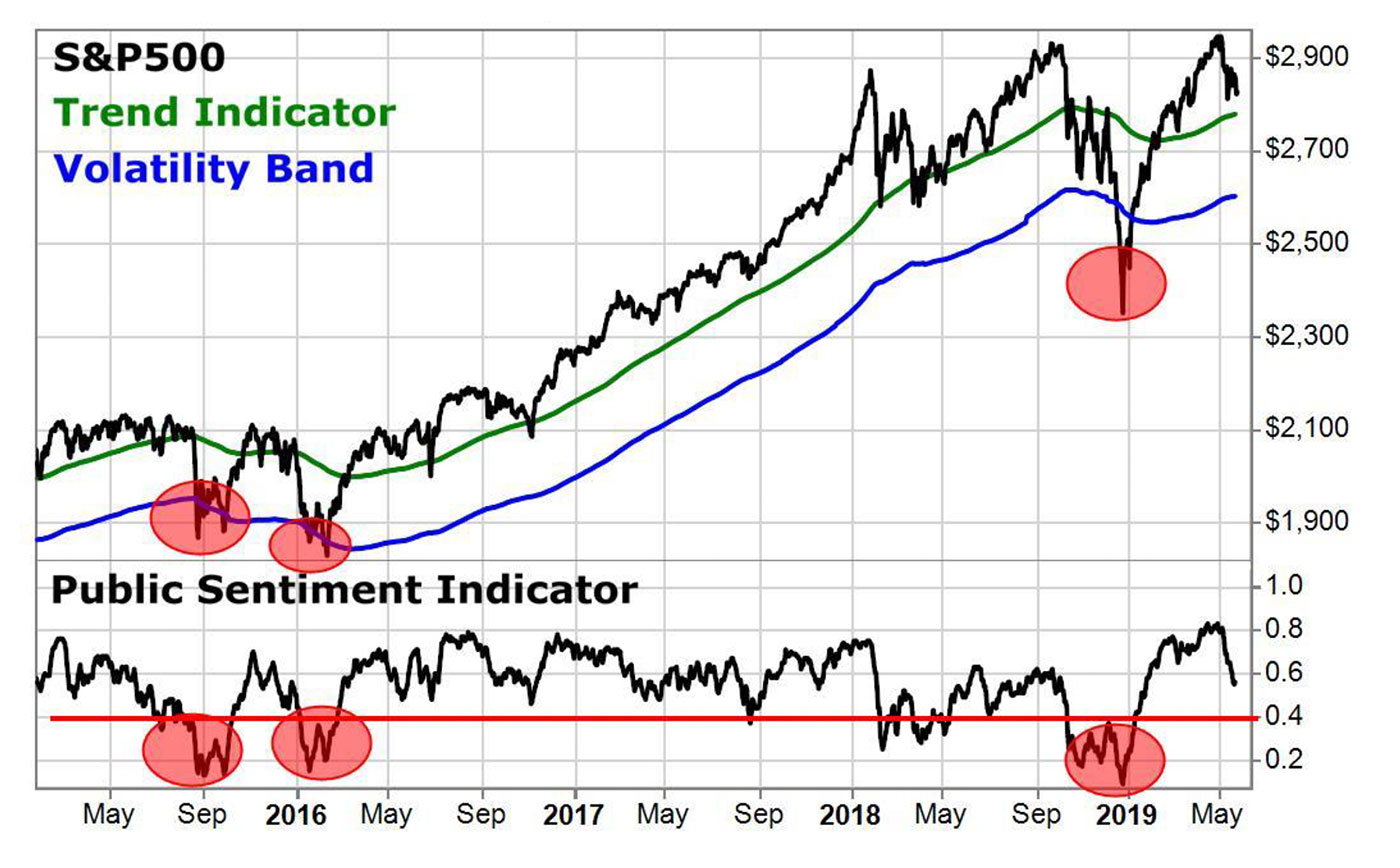
Source: Dr. Richard Smith
So far, we have primarily confirmed the situation that many investors and speculators typically expect.
When small-investor sentiment reaches a bullish or a bearish extreme, you can often expect at least a temporary price reversal.
If, however, we return to the bullish sentiment extremes, we can see in Figure 3 that there are many more instances where small investors became excessively bullish but the S&P 500 does not experience a significant reversal.
We were able to identify these situations by the fact that the price of the S&P 500 remained close to the primary trend line and inside of the tighter (purple) volatility bands. (These tighter volatility bands are typically about half of a standard deviation.)
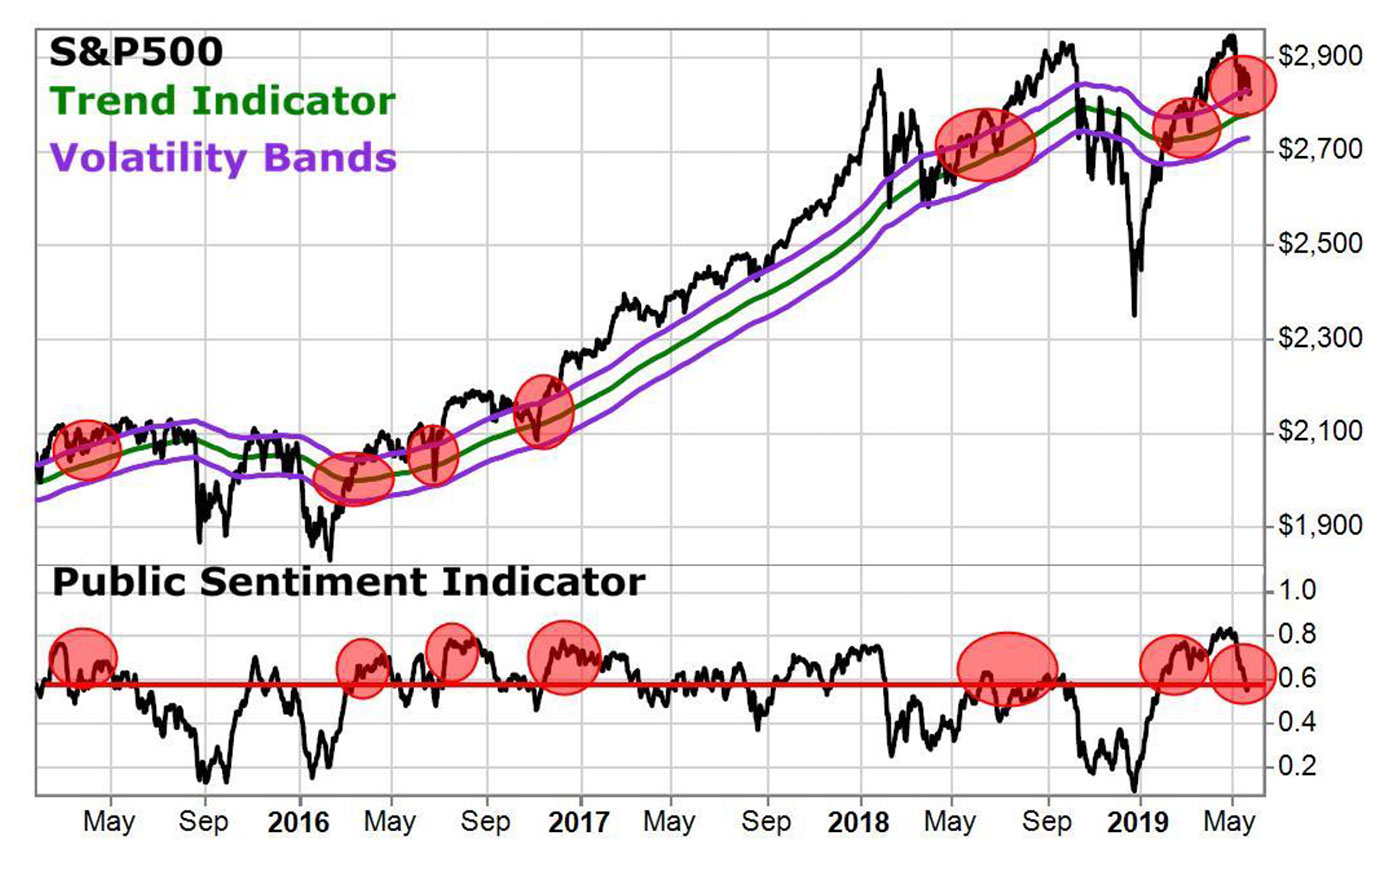
Source: Dr. Richard Smith
We backtested this situation in the S&P 500 where sentiment has reached a bullish extreme but price remains close to the primary trend. We went back 20 years and found 17 such instances. We then looked at how much the market had moved lower or higher over the next 30, 60, 90, and 120 days.
We found that across all such time frames, the S&P 500 was significantly higher following extreme small-investor bullishness when price is still close to the primary trend line.
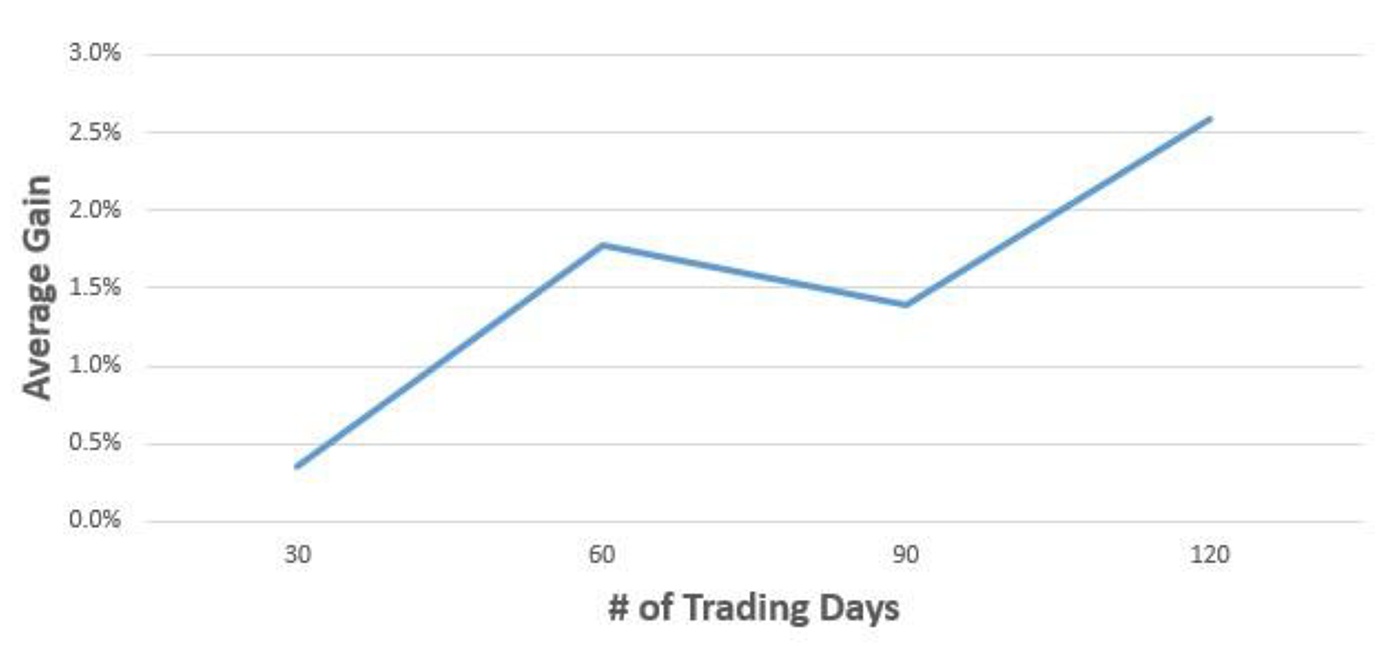
Source: Dr. Richard Smith
This year has been interesting for the markets so far. The S&P 500 came back strong early in 2019 from December 2018 lows. The S&P 500 made a high in late April and price ticked just above the upper volatility band at that time. We then saw a steady correction through the month of May, which, according to our analysis, appeared to exhaust itself by the end of May.
Small-investor bullish sentiment, though it has retreated from highs, has remained elevated (above 60%), even when price returned to within the lower volatility bands (as seen in Figure 5). We expect the S&P 500 will be higher than its early June levels for at least the next 120 days.
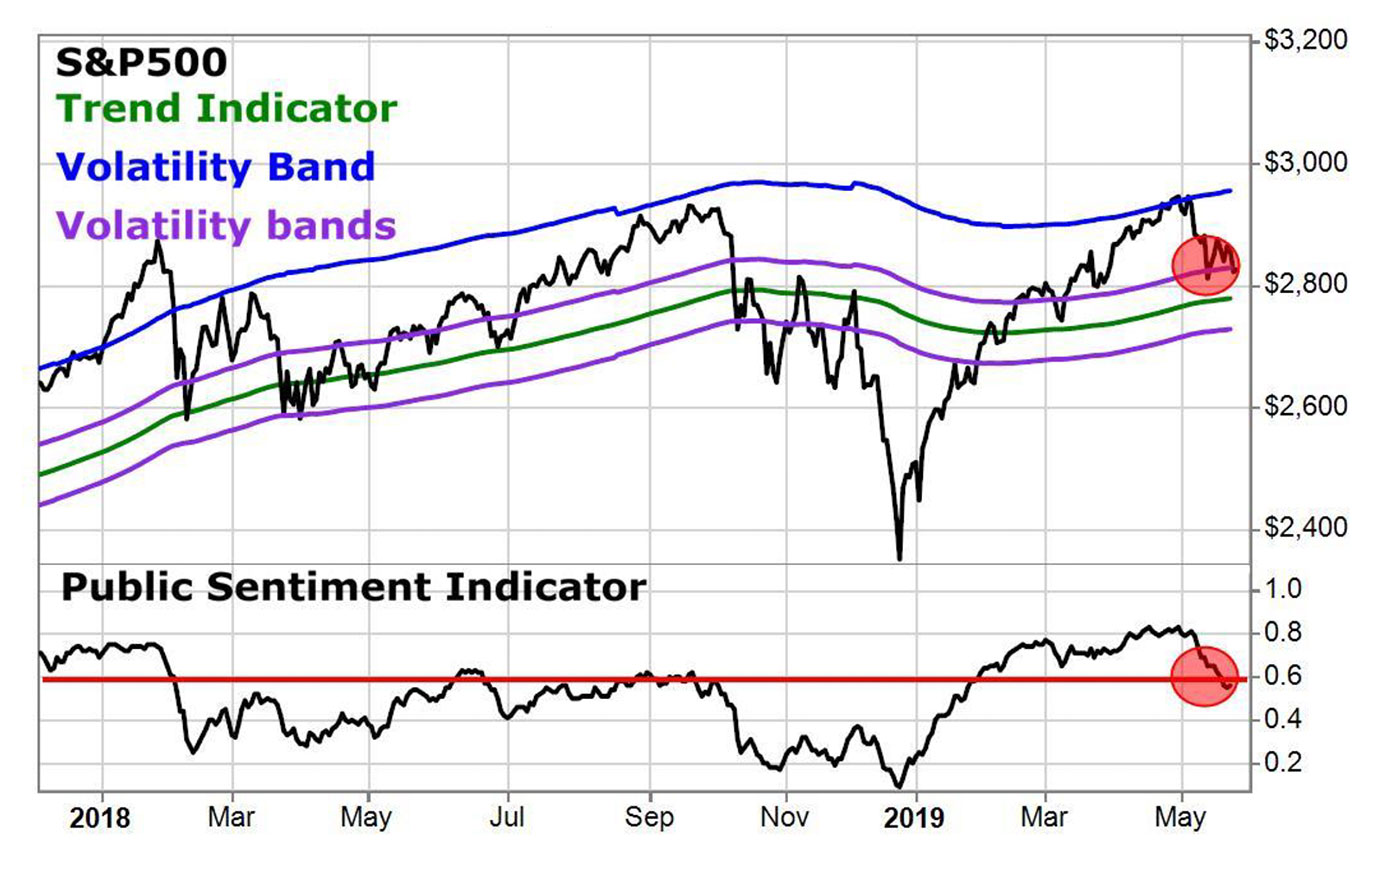
Source: Dr. Richard Smith
To summarize, when you see an extreme in small-investor sentiment, check to see if price has also become extended away from the primary trend line. If price has jumped sharply away from the trend and sentiment has reached an extreme, it’s likely there will be a sharp reversal back toward the supporting line.
On the other hand, it’s important to remember that the small investor isn’t always wrong at sentiment extremes. When price remains close to a primary trend line in spite of a temporary extreme in small-investor sentiment, it’s more likely to be an indication of a continuation of the primary trend rather than a reversal of the primary market trend.
And always remember that financial markets are anticipatory systems where market participants are constantly attempting to “out-anticipate” one another. Once the market participants have identified a valid and exploitable instance of groupthink, it quickly leads to “groupthink about the original groupthink.”
When it comes to financial markets, we should all be very wary of “conventional wisdom.” It doesn’t last very long. More specifically in the context of the analysis in this article, when it comes to small-investor sentiment, it isn’t always smart to bet against the little guy!
 Dr. Richard Smith, the founder and CEO of TradeSmith, is a pioneer of behavioral investing techniques. His company is dedicated to empowering individual investors through the use of intuitive, easy-to-use software tools. Dr. Smith is a UC Berkeley-trained mathematician and earned his doctorate from The Thomas J. Watson School of Engineering and Applied Science. He has consulted with U.S. government agencies and Fortune 500 companies. https://www.tradesmith.com