


At a time when markets seem confused and lacking in confidence, it’s important for investors not to exhibit the same qualities. Doing so typically leads to overtrading and/or poorly timed market-allocation decisions. Lowry Research’s approach isolates the components of Supply and Demand in the market so that we can objectively gauge the relative health of the market’s primary trend. Despite all the noise, geopolitical uncertainty, and creeping fear, stocks continue to demonstrate underlying strength and resilience as they move through another earnings season and political event.
Just as our indicators suggested, and many professional investors likely realized, the major market indexes were overbought on March 1, 2017, and due for a correction. What many were expecting to happen—gains to be consolidated over a period of many weeks—has been playing out. Having the tools and the confidence to make this assessment can prove invaluable, but it must be rooted in facts gained by closely observing the market, not opinions based on predictive assumptions.
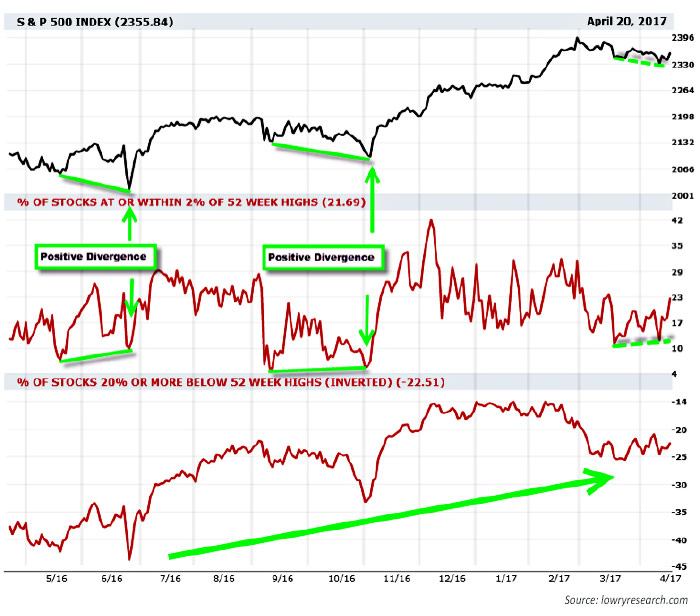
The chart below is part of a series of indicators we use to “listen to” the market. The two panels underneath the S&P 500 Index price depict Lowry’s % of Operating Company Only (OCO) Stocks at or within 2% of 52-week highs and Lowry’s % of OCO Stocks 20% or more below 52-week highs.
By understanding the trends in these opposing numbers for operating companies, we can better understand if conditions are more characteristic of internal market strength or weakness. After spiking dramatically in early December, the percentage of stocks at or near new highs continued to make a series of lower highs even as the large-cap price indexes made further new highs.
This demonstrated a higher degree of market selectivity, translating into subtle internal weakness, which is typical ahead of classic market corrections. Since then, the indicator has made lower highs and lower lows, but it may be headed toward a positive divergence, similar to those present at both the June 2016 and November 2016 market lows. As highlighted in the chart, positive divergences occur when the price of the S&P 500 makes a comparatively lower low but the Lowry’s % of OCO Stocks at or within 2% of 52-week highs makes a higher low.
Taking the other side of the universe of stocks—those in their own bear markets (-20% or more)—similar trends are reflected. This indicator, which is inverted on this chart, captures an aspect of the longer-term trend of decreased selling, which remains intact, as evidenced by the longer-term trend of higher highs and higher lows in place since Feb. 2016.
Contrast the current reflections of Supply and Demand in the market to those observed historically headed into a major market top. We learn that there are always signs of a bear market well before the worst of the bear arrives. For example, Lowry’s % of OCO Stocks at or within 2% of 52-week highs typically shows a protracted series of divergences in its highs versus the highs of the major price indexes that persists for several months and sometimes as long as two years.
Similarly, Lowry’s % of OCO Stocks 20% or more below 52-week highs typically begins to rise steadily despite index prices rising. This indicator, along with our other proprietary indicators, offers tangible evidence and an early warning that internal weakness is progressively worsening under the surface of the major price indexes. When price alone is examined, this deterioration is almost always masked by large-cap issues, which are typically the last to roll over in the final stage of bull markets.
While the timing of a sustained resumption of the intermediate-term uptrend is not yet clearly defined, our indicators continue to suggest the market is undergoing a natural correction both in time and price as determined by the forces of Supply and Demand in the market. However, as we’ve done for nearly 80 years, Lowry Research will continue to closely monitor the internal health of the balance of Supply and Demand as we move ever closer to the next, inevitable bear market cycle. In so doing, we continue to help our clients benefit from the best parts of bull markets and avoid the ravages of the next bear market.
NYSE PERCENT OF OCO STOCKS NEAR 52-WEEK HIGHS
The opinions expressed in this article are those of the author and do not necessarily represent the views of Proactive Advisor Magazine. These opinions are presented for educational purposes only.
 Vincent Randazzo, CMT, is a senior market analyst at Lowry Research with more than 15 years of experience in professional equity market research, technical analysis, and market intelligence. Before joining Lowry, Mr. Randazzo was chief market analyst at NASDAQ. He was also director of research at ICAP and a research salesperson at Morgan Stanley and UBS. He has been a Chartered Market Technician (CMT) since 2008. For more information on Lowry Research, please visit lowryresearch.com.