

For as long as there has been a stock market, amateur and professional analysts have been trying to find correlations between external factors and the performance of markets. These efforts have ranged from the outright silly and coincidental to the most complex and serious econometric models.
Some such analytic efforts, especially those related to the calendar, may have a basis in real facts and cause and effect. Tax-related issues, business and investment reporting periods, commodity seasonality, political election cycles, and sentiment at various times of the year tend to have shown some repeatable patterns over the years. Many of these factors can be built into active trading models using sophisticated algorithms and any number of statistical factors.
Designing a model-based strategy is a challenging task that typically involves researching historical data to discover an exploitable market edge. Once identified, a process is built that includes trading rules (the “strategy”) that the manager or “computer” will apply to take advantage of that edge.
In his article “The case for mechanical trading strategies” (published in Proactive Advisor Magazine in July 2016), quantitative strategy consultant Thomas Krawinkel of StatisTrade wrote,
“Mechanical strategies have the distinct advantage of making the best use of historical data. They allow for a backtesting process that comes as close as possible to simulating the real-life execution of the strategy concept. Without overlooking any trades, a computer can go through large amounts of data in very little time. In contrast, human decisions cannot be consistently reproduced (because of the effects of stress, moods, or subjective judgment) and require significant time to simulate trade results even for short periods.
“Validation is the process of making sure that the trading concept provides a real market edge, meaning one likely to persist in the future. In other words, validation focuses on identifying the ‘fool’s gold’ from the real precious metal before getting investors to buy a stake in the prospecting venture.”
The concept of “fool’s gold” in constructing longer-term investment strategies or identifying specific tactical trading patterns is an intriguing one. The challenge, as investment author and analyst Mark Hulbert once remarked, is to be wary of the difference between “statistical significance and investable significance.”
Which brings us to a look at one of those “silly and coincidental” indicators: the “Super Bowl indicator.”
Specifically, what will the “Super Bowl indicator” say about market prospects for 2017? And who should you be rooting for in the Super Bowl in just under two weeks?
With the participants of Super Bowl LI (51) now identified as the NFC’s Atlanta Falcons and the AFC’s New England Patriots, investors may want to put aside any ingrained rooting interests and become, at least for the short term, enthusiastic Falcons fans.
Why?
According to Investopedia, the Super Bowl indicator is “based on the belief that a Super Bowl win for a team from the old AFL (AFC division) foretells a decline in the stock market for the coming year, and a win for a team from the old NFL (NFC division) means the stock market will be up for the year.”
Of course, they also point out how this is definitely a case of the difference between statistical significance and investable significance:
“Though historically speaking the Super Bowl indicator boasts an 80% accuracy rate, remember the old maxim: correlation does not imply causation. In 2008, despite the New York Giants (NFC division) winning the Super Bowl (indicating a Bull Market), the stock market suffered one of the largest downturns since the Great Depression. Though the indicator is an interesting take on predicting the stock market, by no means should the correlation dictate an individual’s portfolio construction.”
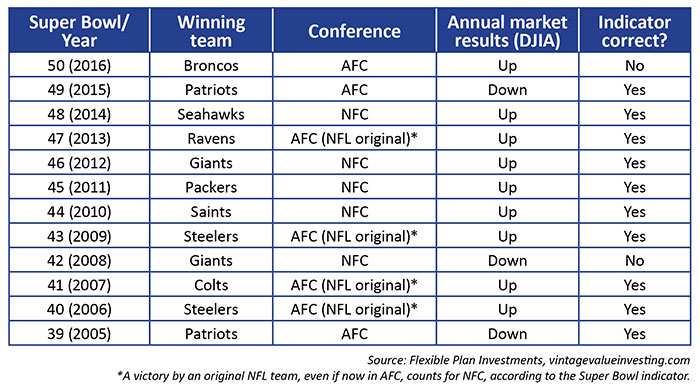
Of course, as all financial journalists and analysts know, as soon as a statement like that is made, it will be disproven. With the AFC’s Denver Broncos winning Super Bowl 50 and the Dow Jones Industrial Average well in the green for 2016, the Super Bowl Indicator’s winning streak came to an end last year.
And while we can have fun discussing this particular “indicator,” it just confirms what serious market strategists know to be true. No matter the strengths of any predictive methodology based on seasonality or analysis of historical patterns, it can never forecast with absolute certainty a short-term or intermediate-term market outcome.