


Whew! What a strange market we are experiencing right now. As of this writing (Feb. 6, 2019), the past 42 trading days have not disappointed fans of wild swings. The market environment has ranged from major intraday volatility to successive significant drops to the post-Christmas utopia of relative calm. This latter segment produced 22 positive days for the S&P 500 out of 28 trading days. Incredible! What a Jekyll and Hyde personality change we have had.
So, what happens from here?
Well, the S&P 500 ended down today. Had it ended up, it would have produced 23 positive days in the past 29 trading days. The number of times this would have occurred since the inception of the S&P 500 ETF SPY is only six of 6,553 periods, or a less than a one out of 1,000 events. If SPY were positive for 24 of 30 trading days, it would be three occurrences out of 6,554 periods. Twenty-five positive days out of 31 trading days has occurred zero times out of 6,555 periods. We were close to truly uncharted territory and “running out of sigmas”!
To bring analysis of the current market environment to a more realistic and robust data set, I decided to look at other “20 positive days out of 28 trading days” events. There have been 66 of these events since the inception of SPY in 1993. Many of these events are within groupings of other 20-positive-day events and could be distilled down to 25 periods that are close to the market behavior we are experiencing now.
I then looked out into the future 42 days from each of those 25 periods (to correspond with these past 42 days) starting with the first 20-positive-day event. I also looked to see if it was a solo event or the beginning of a grouping—and then tested the market returns.
Despite my bias that the results would be either inconclusive or negative, I was pleasantly surprised that 21 of 25 times the market was positive after the next 42 days. It is unusual to have such frothy beginnings set off a further market rally.
A 21-4 win-loss record is almost a Cy-Young-Award-winning statistic!
I then expanded the study to go 42 days into the future from the last 20-positive-day event within a grouping—which many times increased the holding period from the first 20-positive-day event within a grouping. It produced 19 of 25 winning trades, but the returns were even stronger.
From a very short-term perspective—within a week of today—the odds are strongly in favor of a short-term grouping of negative days. (Editor’s note: The S&P 500 was down about 1% on the day after Mr. Naismith completed his analysis.)
However, from Feb. 1, 2019 (which was a 20-positive-day event) to the beginning of April (going out 42 trading days), the odds are historically very strong that we can see some extra gain. The average total 42-day gain from the first 20-positive-day event is 2.7%, and it is 3.7% from the last 20-positive-day event.
FIGURE 1: BUYING SPY ON FIRST 20-POSITIVE-DAY EVENT
AND SELLING 42 TRADING DAYS LATER
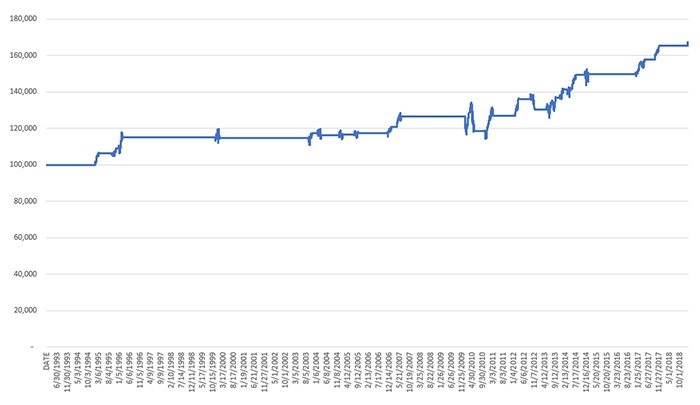
Return curve for $100,000 investment.
Source: Kensington Analytics
FIGURE 2: BUYING SPY ON THE FIRST 20-POSITIVE-DAY EVENT AND SELLING 42 TRADING DAYS AFTER THE LAST 20-POSITIVE-DAY EVENT
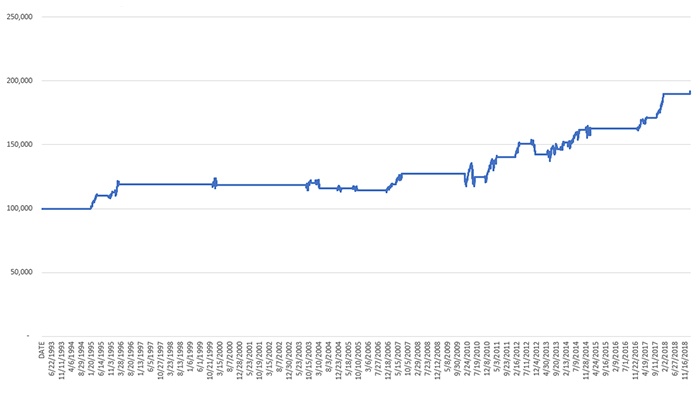
Return curve for $100,000 investment.
Source: Kensington Analytics
There are some other pieces of evidence that point to a decent market environment until about the end of May.
An article I wrote for Proactive Advisor Magazine in late November 2018 (“Cautious market observations for December 2018 through May 2019”) reviewed several indicators that cautioned that a potential rocky period was coming up for the market. That certainly turned out to be the case for December.
One of the specific warnings was if SPY’s October 2018 low of 259.85 was breached, then it could get ugly. It was breached on Dec. 10, 2018, and the markets fell 11.3% until Dec. 24. The good news is if the market price (SPY) finishes the month higher than that October low prior to the beginning of May, the odds are strong for positive returns until the end of May. The closing price for SPY at the end of January was higher than October 2018 low, a positive sign.
Another great historical indicator is looking at 10-month trailing returns for the S&P 500. When the 10-month trailing return turns positive, as it did in January 2019 after a negative November and December, that is usually a positive sign for the short to intermediate term.
Staying invested when the 10-month trailing return on the S&P 500 is positive (and exiting when negative) has been a strategy that has outpaced an S&P 500 buy-and-hold strategy by 0.25% per year since 1960—that is a lot of additional return on a compounded basis! It has had only one period of 20% drawdown or worse. (It got caught in the 1987 crash.)
To conclude, technically the market environment may have come out of the woods from the 20% loss it experienced between Sept. 20, 2018, and Dec. 24, 2018. Keep in mind, the markets are quirky right now and we have the possible resumption of the trade war starting at the end of February. Also, liquidity, especially for the S&P 500 futures market, has been concerning in times of market volatility. According to data and content provider Nanex, their unique classification gauge of liquidity for the futures market is currently in the “Banana Republic” category. I’m remaining vigilant in the event of returning excess volatility.
 Ian Naismith is a partner and the index designer of Smooth Sailing Indexes Inc., which is a leader in tactical “risk-on/risk-off” index development. Mr. Naismith has been analyzing and trading the markets since the early 1990s. He is a member of the National Association of Active Investment Managers (NAAIM) and has also served as board member and president. www.smoothsailingindexes.com