
Slicing the market
Slicing the market

An active manager’s view of a complex investment world.
Like many people, I can often be found in the kitchen preparing meals. I prefer my food on the hot and spicy side, which typically means the recipe includes an onion as one of the ingredients. Unfortunately, I’ve never encountered a recipe that said to throw the whole onion into the mix. The recipe always calls for you to slice, dice, chop, or mince the darn thing first. That’s where the fun begins, because there are many ways to prepare an onion, and I’ve been known to try a completely new way every now and then.
It’s a similar story for investments. The entire investment universe is immense, consisting of stocks, bonds, commodities, and myriad alternatives. For this discussion, we’ll keep things simple and only talk about stocks. However, with tens of thousands of stocks in the world, it might be easier to get a handle on the situation if we sliced them into smaller, more manageable pieces.
Dividing the stock universe
A common way to accomplish this task is to categorize each stock by its sector and industry. There are many stock classification systems in use today, with the Industry Classification Benchmark (ICB) and the Global Industry Classification System (GICS) among the most popular. Dow Jones and FTSE maintain the ICB database, while MSCI and Standard & Poor’s developed the GICS methodology.
Although each uses slightly different terminology, both classify all stocks into 10 major sectors and further divide them into industries, groups, and subsectors—four levels in all.
There are many investment products focusing on the 10 major GICS sectors. You’ll find indexes, mutual funds, and exchange-traded funds (ETFs) tracking the performance of each and providing targeted exposure.
Now that we have a way to divide the universe into more manageable pieces, we still need a method to help determine where to invest.
Relative-strength analysis
Relative-strength analysis is one of the approaches an active manager may use and an effective way to gain insight into what is going on—or what is working—in the market at any given time. Relative strength is an easy-to-understand investment approach. In its simplest form, it compares the total return of two securities over a predetermined time period. It then invests in the stronger one and avoids the other.
However, selecting the time period is a huge variable. Are active money managers interested in identifying the securities with the greatest relative strength over the past week, month, year, or some other time frame?
Analyzing different intervals will often reveal that the strongest securities of the past week have little overlap with the strongest of the past year. Choosing too short of a period can produce false starts, whipsaws, and excessive trading.
Meanwhile, too long of a period can miss new opportunities and prolong a stay in fading trends.
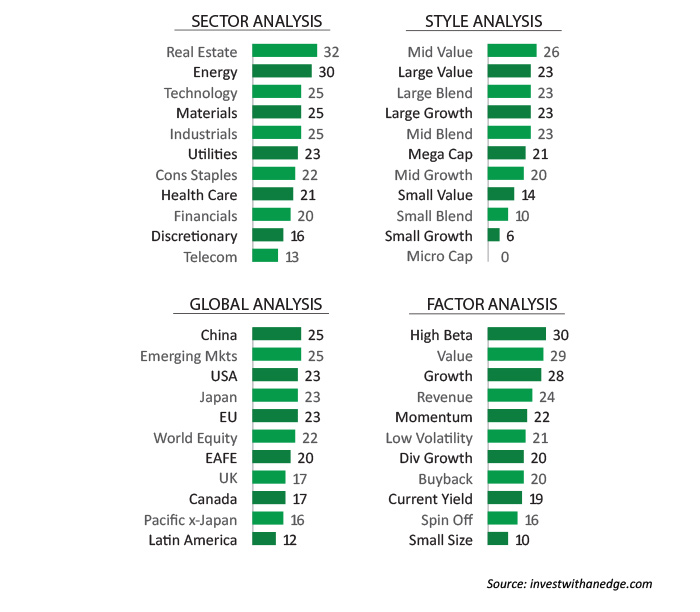
As the graph illustrates, relative strength is determined by intermediate-term momentum. The numbers represent the annualized value of the current trend. Performing relative-strength analysis on ETFs tracking the 10 major sectors plus Real Estate quickly reveals where the market’s strengths and weaknesses reside.
Earlier this year, using an intermediate time frame of about a couple of months, Utilities and Energy were the two strongest sectors. However, the Utilities sector had been at the top for many weeks and Energy was climbing. This suggests market strength was rotating into Energy. Now, Energy remains strong, although Real Estate is even stronger.
The Technology, Materials, and Industrials sectors are all sitting above the halfway point and are all showing positive performance trends over the period being evaluated.
This brings up another point: a relative-strength ranking alone doesn’t tell us if the various categories are trending upward, downward, or sideways. Being on top could mean a sector is falling slower than the lower ranked categories. It is easy to overcome this limitation by including a neutral investment, such as a money-market fund, in the mix.
Another way is to quantify the relative-strength calculations. The numbers in the graph represent the annualized value of the current trend. Those with positive results are trending up, and those with negative results are trending down. Currently, all categories are trending up and shaded in green.
The importance of analyzing relative strength and the trending of sectors—and groups within sectors—cannot be underestimated. Large institutional funds will at times move en masse via “sector rotation,” as they assess major macro trends,the implications of Fed policy, and business and economic cycles in their decision-making.
This was in full force earlier this year, as large funds rotated out of the subgroupings of higher-beta Internet and Biotech stocks and into less volatile larger caps across several different sectors. Active managers, within the parameters of their diversified strategies, need to monitor these rotations on a continual basis.
Further slicing and dicing
Much like the onion that can be sliced and chopped many different ways, so can the market, and active managers have many different strategies that do just that. Instead of dividing by sectors, what if stocks were categorized based on geographical regions or various fundamental and technical factors? Once again, there are indexes, mutual funds, and ETFs that make this possible.
The nine-square Morningstar style box is another way to slice the market. It separates stocks into three sizes—large, medium, and small—and further divides them into Value, Growth, or Blend buckets. I like to take it one step further by adding Mega-Cap and Micro-Cap categories.
The same relative-strength analysis can be used against this universe, and doing so reveals the market is currently favoring Mid-Cap Value and Large-Cap Value stocks, while Small-Cap Growth and Micro-Cap stocks have been out of favor. Some active strategies use these 11 buckets to implement the most appropriate portfolio allocations.
Also, it is possible to chop up the stock market based on a single quantitative factor, such as beta, yield, volatility, size, revenue, momentum, and many others. There are investment vehicles tracking these, too.
Relative strength is just one tool available to active managers. This tool, combined with the ability to slice and dice the market along many different lines, provides the ability to identify and overweight the strongest areas of the market and to avoid the weakest. Of course, investors could always take the passive approach of throwing the whole unsliced onion in and hoping for the best—definitely not a recipe favored by active managers.
The opinions expressed in this article are those of the author and do not necessarily represent the views of Proactive Advisor Magazine. These opinions are presented for educational purposes only.
 Ron Rowland is the founder and former executive editor of the online investment advisory services All Star Investor and Invest with an Edge. He is also a former portfolio manager for Flexible Plan Investments. Quoted widely in the financial press, Mr. Rowland is an industry expert for insight on sector rotation and actively managed ETF strategies.