The month of August was an extraordinarily quiet one, at least with regard to U.S. equity market volatility.
In fact, market volatility hit levels of passivity not seen for over 40 years. This was somewhat out of character, as August is historically the third most volatile month of the year.
CNNMoney reported the following on August 31, 2016:
“The S&P 500 is on track to close on Wednesday with a less than 1% move (in either direction) for the 38th consecutive day. That’s the longest stretch since the summer of 2014, according to a CNNMoney analysis of FactSet statistics.
“To take it a step further, before last Friday, the S&P 500 made a bit of history. The benchmark index went 17 straight days of moving less than 0.75% between the day’s peak and the day’s low. … That hadn’t happened on records going back to 1970.
“The relative silence on Wall Street is particularly striking when compared with the shockwaves that rippled through global markets exactly a year ago. At one point in August 2015, the S&P 500 experienced six consecutive 1% moves, including three-straight sessions of dramatic 2% plunges.”
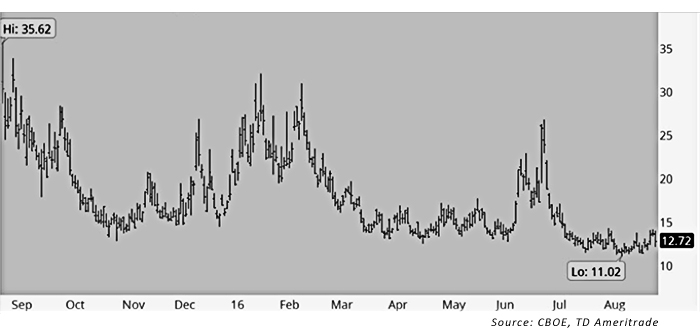
This year’s August lull was reflected in the CBOE Volatility Index (VIX), which hit intermediate-term lows.
FIGURE 1: CBOE VOLATILITY INDEX, 12-MONTH TREND THROUGH AUGUST 2016
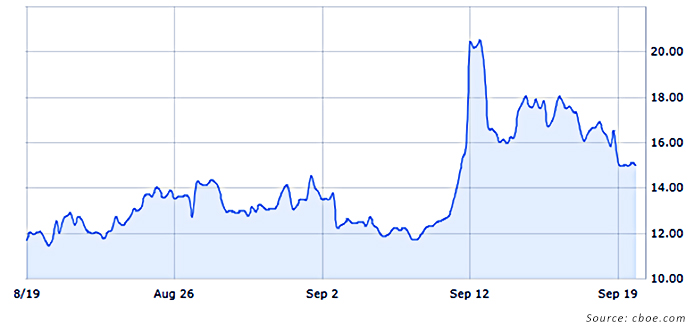
So far, September has more than lived up to its reputation as the fourth most volatile month of the year, with the VIX spiking and a number of major index moves—both positive and negative—over 1% already in the books. Further, according to a recent Seeking Alpha article, “Amazingly, September is the only month with negative monthly average returns for past 100-, 50-, and 20-year time frames.”
FIGURE 2: VIX SPIKES IN SEPTEMBER 2016
While September’s return to volatility is not so surprising, what do investors have to look forward to in October and into early November? October has historically been the most volatile month of the year, typically known not just for market crashes but also for the highest number of daily moves over 1% for the major indexes.
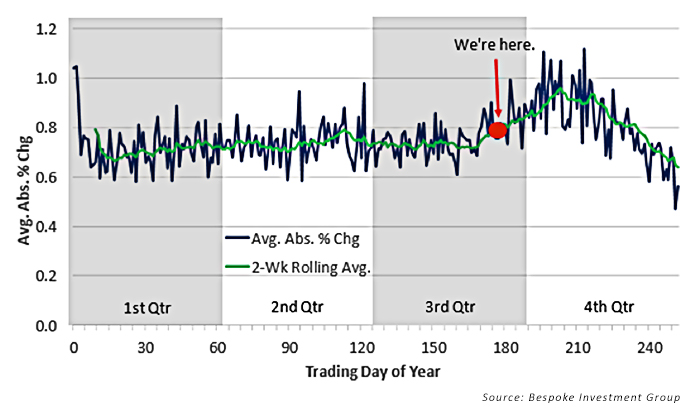
Said Bespoke Investment Group at the end of last week:
“Once September rolls around, we start to see a notable pick-up in daily volatility for the S&P 500. From early September through early November, volatility picks up more and more. The most volatile trading day of the year has historically been day 213, which is usually around November 1st or 2nd. From there, the market’s daily moves get smaller and smaller as we enter the holiday season, and things really die down around Christmas. The least volatile day of the year is actually the second to last day of the year (day 251), which has historically averaged a change of just +/- 0.47%.
“If you think the last few days have been volatile, buckle up, because the red dot in the chart below is where we are now—at trading day 176 of 2016.”
FIGURE 3: S&P 500 AVERAGE ABSOLUTE DAILY % CHANGE BY TRADING DAY OF THE YEAR (1928–PRESENT)