


Well, it’s that time of the year again—where we are all supposed to be bulls because so many services, opinions, and stats indicate we are foolish to ignore the patterns of the past and the sure thing of “ecstatic” returns to come. So, if you are in the bull camp for the next few months, here are some thoughts on a possible opportunity, similar to one outlined in an article published last year at this time (“Favorable long-term seasonal trends of ETFs: December–February”).
The difference this time is that last year’s commentary used a very sophisticated rule set for seasonality that included the following factors: (a) It used rolling time-line scales within a larger fixed time line as a consistency measure. (b) It analyzed positive subperiod returns versus negative subperiod returns. (c) It was hierarchically based on ratios.
None of that this time. Nope.
This time, we’re throwing caution to the wind and taking a static look at the last eight December–February time frames (11/30/09–2/28/17) on a month-to-month basis and a total-period basis. This time, we are comparing 706 ETFs that have existed since Nov. 30, 2009 (equities, commodities, debt, currencies, etc.) in our seasonal engine and finding themes and the most successful behavior from a total-return and “percentage of months positive” approach. So, I analyzed an enormous amount of information that could lead to a seasonal ETF strategy that outperforms the S&P 500. After all, this bull market will last forever and ever. (I’m just joking, I think. By the way, last year’s seasonal picks knocked the cover off the ball.)
So, after this extensive number crunching, if you wish to “buy and hold” through the upcoming December through February, the best seasonal performances thematically from 2009–2016 are from semiconductors, homebuilders, biotechnology, solar energy, medical devices, real estate, and mid-cap value.
VanEck Vietnam, WisdomTree Small Cap Dividend Europe, and many iPath Bloomberg commodity ETNs represent small, interesting outliers—but again, I am looking for themes that are supported by various products of all ETF providers. During those 24 months of observation (three months per year times eight years), medical devices and high-yield bonds topped the list with positive gains 22 out of 24 months. Others that were consistently positive are utilities, health care, preferred stock, and homebuilders.
For December, the best performances for the eight periods during 2009–2017 were turned in by semiconductors, regional banks, solar energy, homebuilders, real estate, micro-caps, and small-cap value ETFs. The areas that had the biggest percentage of positive months were real estate and medical devices at 100%. In fact, only 12 out of 706 ETFs were positive every December, and almost all were real estate. Many indexes, sectors, and industries turned in seven out of eight positive Decembers.
For January, the best performances for the eight periods during 2009–2017 were turned in by silver, gold, solar energy, biotechnology, medical devices, preferred stock, and long-term government bond ETFs. The areas that had the biggest percentage of positive months were five short-term bond ETFs at 100%. That’s it.
Many bond ETFs had seven of eight positive Januarys. Biotechnology and preferred stock were positive seven of eight Januarys. Gold, silver, and miners overall yielded great returns in January—however, they ranged from 50% to 63% positive.
For February, the best performances for the eight periods during 2009–2017 were turned in by semiconductors, retail, gold, technology, consumer staples, and consumer discretionary ETFs. The areas with the biggest percentage of positive months were … a bunch! Believe it or not, 148 out of 706 ETFs reviewed have been positive in these February periods 100% of the time.
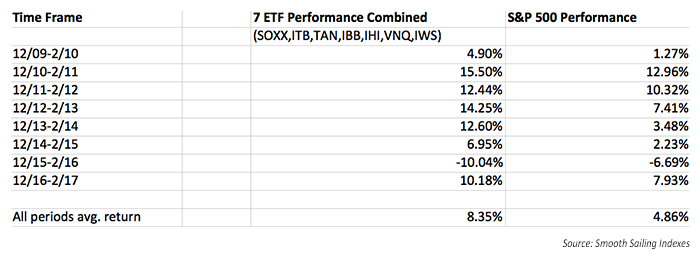
The following table summarizes the data for seven ETFs analyzed for each three-month period of December through February for eight years (2009–2017)—plus it provides S&P 500 returns for comparison purposes. These are the seven ETFs:
- SOXX: iShares PHLX Semiconductor ETF
- ITB: iShares U.S. Home Construction ETF
- TAN: Guggenheim Solar ETF
- IBB: iShares Nasdaq Biotechnology ETF
- IHI: iShares U.S. Medical Devices ETF
- VNQ: Vanguard REIT ETF
- IWS: iShares Russell Mid-Cap Value ETF
7-SECTOR ETF PERFORMANCE VS. S&P 500 FOR DEC.–FEB. PERIODS (2009–2017)
The opinions expressed in this article are those of the author and do not necessarily represent the views of Proactive Advisor Magazine. These opinions are presented for educational purposes only.
 Ian Naismith is a partner and the index designer of Smooth Sailing Indexes Inc., which is a leader in tactical “risk-on/risk-off” index development. Mr. Naismith has been analyzing and trading the markets since the early 1990s. He is a member of the National Association of Active Investment Managers (NAAIM) and has also served as board member and president. www.smoothsailingindexes.com