
Retirees’ oncoming financial tsunami
Retirees’ oncoming financial tsunami

It is different this time: The impact of demographics on sequence-of-returns issues.
It isn’t a question of if the next bear market will occur, but when. But this one will be different. It has the potential to be a financial superstorm. Like all major disasters, the reasons it will cause more pain than any bear market before it are clearly visible. Will active management save the day for your clients? Only time will tell, but planning ahead is always the best offense when it comes to disasters.
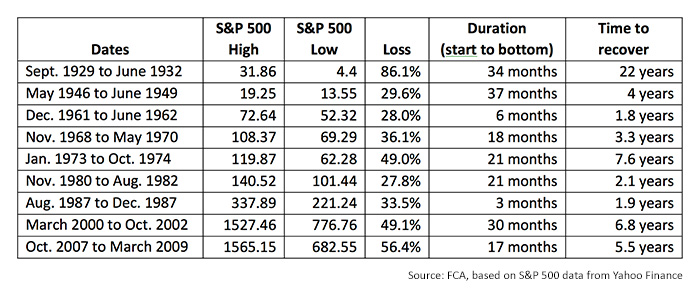
There’s nothing new about bear markets. They are a reality of financial markets and the human psyche. In terms of mega-bears, the U.S. has been through eight since the Great Depression and its lengthy recovery period of 22 years following the stock market crash of 1929. Each one has taken its toll, with the 2000–2002 market crash erasing more than $9.3 trillion in equity values.
TABLE 1: HISTORICAL U.S. BEAR MARKETS
What will make the next bear market different?
What will set this bear market apart simply lies in demographics and the little matter of sequence of returns.
In 2000, the bulk of the baby boomers were in their late 30s to early 50s. There was time for their portfolios to recover from steep drawdowns and new investments to be made into a rising market. The over-65 crowd was under 34 million, hovering around 12% of the population. Retirees were less than 10% of the population, with many relying chiefly on defined benefit pensions and Social Security for their income.
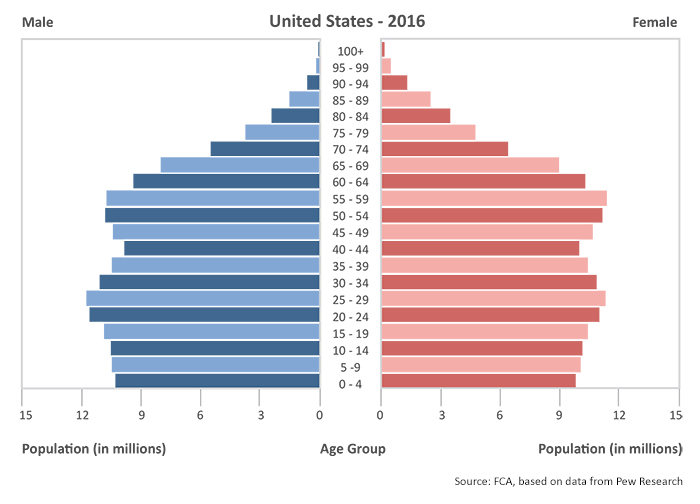
As the 2007–2009 bear market moved into its recovery, the baby boomer bulge also moved higher, but something else was happening. More people than ever before showed up in the longest life span brackets. The over-65 group had increased to 13% of overall population—more than 40 million members.
Figure 1: U.S. DEMOGRAPHIC DISTRIBUTION BY AGE SEGMENT
For new retirees, the dynamics are dramatically different. From 1980 through 2008, the proportion of private wage and salary workers participating in defined benefit pension plans fell from 38% to 20% (Bureau of Labor Statistics 2008; Department of Labor 2016) and the numbers have continued to fall. Workers participating only in defined contribution retirement plans increased from 8% to 31% over the same period.
Additionally, depending on a defined benefit pension plan in retirement is also looking a lot riskier for public-sector employees. On a national basis, state and local public pensions are short an estimated $5 trillion of the funds they need to meet future obligations according to the Actuarial Standards Board’s Pension Task Force. (The public pensions industry maintains the deficit is merely somewhere between $1 trillion and $3 trillion.)
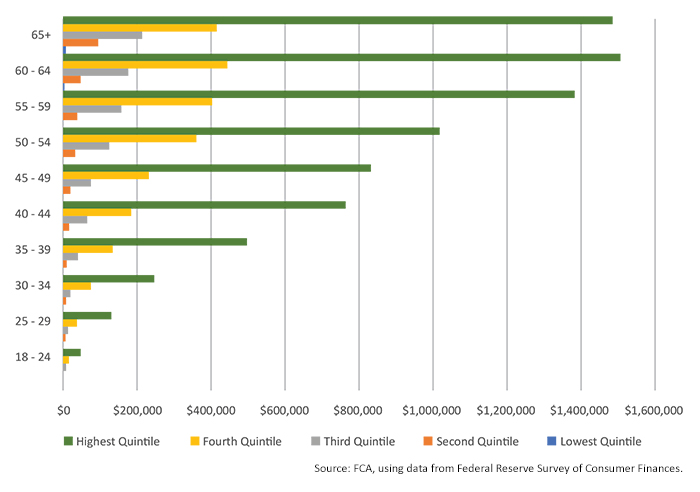
Projections for the U.S. population in 2020 show 54.8 million individuals over the age of 65, 16.1% of the population. It’s no surprise to investment advisors that the majority of assets in the U.S. are held by older households. Peak asset accumulation years tend to take place in the 50–65 age bracket.
Figure 2: MEDIAN NET WORTH QUINTILES BY AGE OF HOUSEHOLD HEAD
The next bear market will coincide with the following conditions:
- The largest-ever cohort of those over age 65.
- Severe deficits in public-sector pension plans.
- A growing number of retirees and near-retirees dependent upon their own assets for future income.
- A monetary policy in the U.S. that has consistently forced investors into riskier assets to achieve portfolio growth, with traditionally “conservative” investment vehicles offering unattractive returns.
It is an interesting conundrum of data since the Great Recession. While overall stock ownership has fallen among low-to-middle-income groups, overall household net worth has greatly surpassed pre-recession levels, rising from about $66 trillion to $96 trillion. According to the Chicago Tribune, however, “10% of the U.S. population owns 80% of stock market wealth.” That said, Forbes wrote in 2015 that “the current exposure (by U.S. households) to equities has only been higher twice in history: 1968 and 2000.”
CNBC in 2016 cited a study by Bank of America Merrill Lynch, concluding, “The average American household has become much more exposed to the stock market. … This level of equity exposure—similar to where the markets peaked prior to the financial crisis—is now roughly 50 percent higher than the 60-year average of 30 percent.”
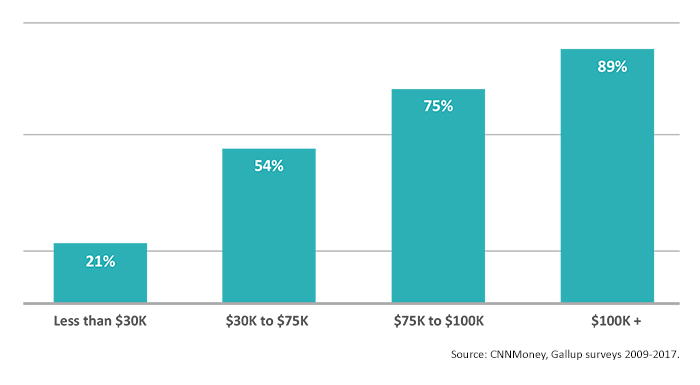
But, according to recent Gallup survey data, there is a vast difference in levels of stock ownership as determined by overall household income and age, with relatively wealthier, older individuals having high exposure to the market. Gallup said this year, “Americans in all income groups below $100,000 are less likely to own stocks than they were from 2001 to 2008. … As a generation, baby boomers—all of whom were in their prime working years during the economic boom of the 1980s and 1990s, and many of whom likely had 401(k)s at work—have above-average rates of stock ownership.”
Figure 3: STOCK OWNERSHIP BY HOUSEHOLD INCOME
The impact of sequence-of-returns risk
The order in which good and bad years occur during the distribution stage of a portfolio has a tremendous impact on how long assets will last. Sequence-of-returns risk is greatest during the first five to 10 years of retirement. Portfolio balances are at their highest levels, resulting in the greatest absolute dollar losses if the market declines. The need to make withdrawals to meet living expenses compounds the loss. Unless the market rebounds rapidly, there isn’t enough time to recover and portfolios can be depleted long before original projections.
A typical recommendation to manage sequence-of-returns risk is to cash out non-equity assets first to meet living expenses. But if households have their highest concentration of assets in equities since 2000, their options are more limited.
 There is little, if any, chance that the bulge of baby boomers that are near or already retired will miss the bullet—that is, a substantial down market in the next five to 10 years. A sharp decline followed by a quick bounce back may be survivable. A mediocre decade of returns with no growth for an extended period, such as the period following the 2000–2002 bear market, could be disastrous for many retirees.
Among the casualties of portfolio drawdowns will be investment management/advisory firm revenues. Today’s growing focus on fee income based on assets under management will, unfortunately, also lead to a significant revenue hit from bear market losses. Given the sequence-of-returns risk, advisory firm revenues may be slow to recover to current levels without a tremendous drive to attract new clients, a feat more difficult following a major market decline.
A holistic, risk-managed approach to more active portfolio management will have the opportunity to shine in such an environment and could well be the salvation of many retirees’ future lifestyles. When active management can limit losses in a market decline, it takes less of a percentage gain and less time to recover from the decline. When drawdowns are managed and minimized, withdrawals represent a smaller percentage of the overall portfolio, moderating their impact on the life of the portfolio.
Taking an active approach to portfolio management runs counter to the mainstream message investors have been inundated with for the last several years—that financial markets always recover and the best tactic is to buy and hold. But can retirees really afford to buy and hold? Not given the reality of bear markets and sequence-of-returns risk.
The next bear market should be an exceptionally interesting and challenging time. Advisors who position their clients in a healthy allocation to risk-managed, active strategies could be recommending an investment approach that spells the difference between a financial “tsunami” and long-term retirement success.
The opinions expressed in this article are those of the author and do not necessarily represent the views of Proactive Advisor Magazine. These opinions are presented for educational purposes only.
 Linda Ferentchak is the president of Financial Communications Associates. Ms. Ferentchak has worked in financial industry communications since 1979 and has an extensive background in investment and money-management philosophies and strategies. She is a member of the Business Marketing Association and holds the APR accreditation from the Public Relations Society of America. Her work has received numerous awards, including the American Marketing Association’s Gold Peak award. activemanagersresource.com