FIGURE 1: REAL U.S. GDP GROWTH (% CHANGE FROM PRECEDING QUARTER)
Other economic data has been fueling some optimism:
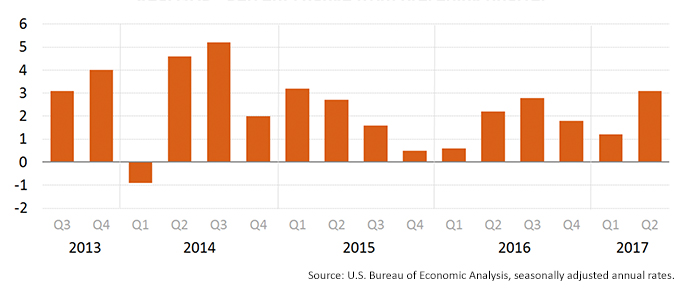
- The Institute for Supply Management (ISM) reading for U.S. manufacturing data hit a 13-year high in September, with the month’s 60.8 reading well above consensus estimates.
FIGURE 2: ISM MANUFACTURING INDEX (SEPTEMBER 2017 REPORT)
- According to the Wall Street Journal, auto sales in September “jumped at the fastest pace of the year.”
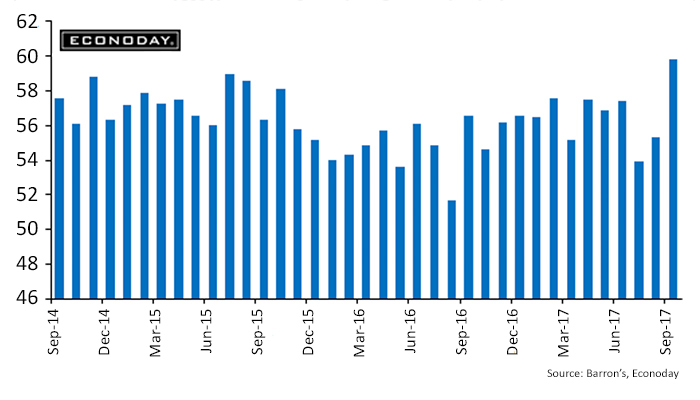
- ISM also reported that the services sector hit a 12-year high in September. ISM wrote, “Economic activity in the non-manufacturing sector grew in September for the 93rd consecutive month. … The NMI registered 59.8 percent, which is 4.5 percentage points higher than the August reading of 55.3 percent. This represents continued growth in the non-manufacturing sector at a faster rate. This is the highest reading since August 2005.”
FIGURE 3: ISM NON-MANUFACTURING INDEX (SEPTEMBER 2017 REPORT)
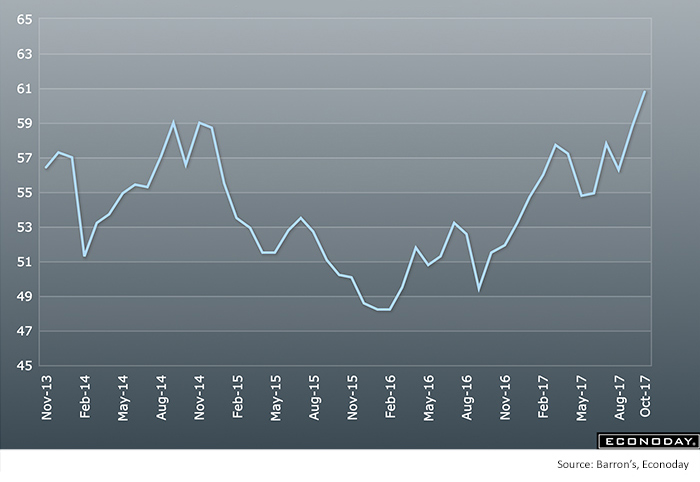
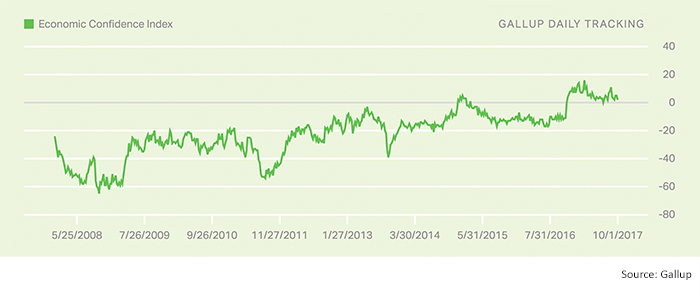
- Gallup’s Economic Confidence Index among consumers remains near highs for the post-recession period. Gallup’s poll is based on the answers to two questions: “The first asking Americans to rate economic conditions in this country today, and second, whether they think economic conditions in the country as a whole are getting better or getting worse.”
FIGURE 4: U.S. ECONOMIC CONFIDENCE INDEX (WEEKLY)
- Although last week’s job report was disappointing in showing overall job losses, most analysts are dismissing some of the data that was clouded by the hurricane season. Despite this, the unemployment rate dropped to a 16-year low of 4.2%, and average hourly earnings registered a 2.9% gain versus the previous year, the largest gain since 2009, according to the Wall Street Journal.
With this backdrop of positive economic news, U.S. equity markets have responded in kind with new highs set on a regular basis. The S&P 500 ended a streak of six consecutive closing highs last Thursday, the longest such streak in 20 years. The NASDAQ Composite registered its 55th closing high of the year and continues to trade near record-high levels.
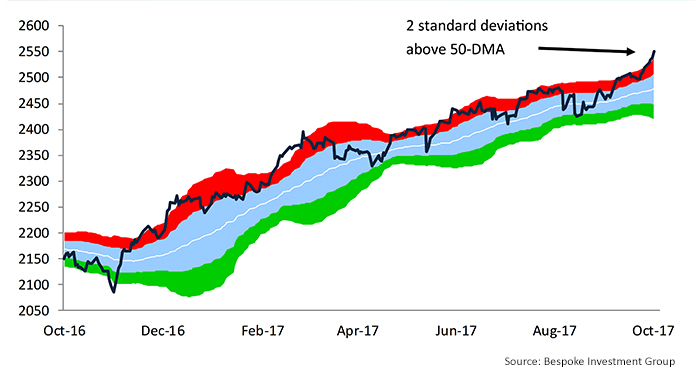
However, valuations and the sheer length of the market’s continued rally are throwing up caution flags for some analysts. Bespoke Investment Group wrote last Friday:
“After taking a breather from late July through early September, investors have rushed back into stocks hand over fist the last month. Since the S&P 500 tested support at its 50-day moving average on September 8th, the index has rallied 3.5% and made another big leg higher. …
“The major indices are in both short-term and long-term uptrends. Volatility is extremely low. Breadth is back to confirming price again. Small caps and the Transports have broken out. And the economy is firing on all cylinders. What could go wrong at this point? …
“We can’t help but question if this is ‘as good as it gets.’ When everything seems to be working perfectly is when prudent investors should at least be on guard. … Equities have certainly gotten extended at current levels. The S&P 500 is more than two standard deviations above its 50-day moving average. You can see that it typically doesn’t get more overbought than this before a pullback or sideways action takes hold.”
FIGURE 5: S&P 500 (LAST 12 MONTHS)