

The fourth-quarter 2018 earnings season moved past its halfway point at the end of last week. For the large-cap segment, FactSet reports that 66% of S&P 500 companies had reported as of Feb. 8.
FIGURE 1: NUMBER OF Q4 EARNINGS REPORTS BY DAY, JAN.–MAR. 2019
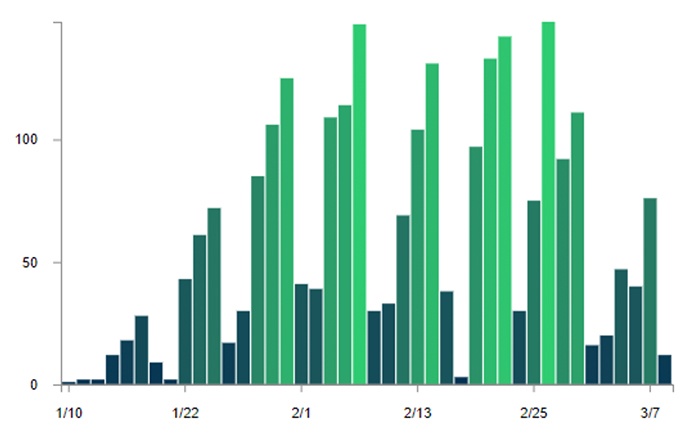
Note: Universe of larger-cap U.S. companies.
Source: Bespoke Investment Group
Despite a fair amount of uncertainty entering the Q4 2018 earnings season, results at the midway point have generally surpassed expectations. However, the outlook for the Q1 2019 earnings season has seen S&P 500 companies providing generally lowered Q1 outlooks, with negative guidance outpacing higher guidance at a rate of almost 5 to 1.
FactSet reported several key earnings season metrics for Q4 2018 on Feb. 8, 2019, paraphrased here:
- Earnings and Revenues Surprises: 71% of S&P 500 companies have exceeded EPS expectations and 62% have reported a positive revenue surprise.
- Earnings Growth: For Q4 2018, the blended earnings growth rate for the S&P 500 is 13.3%. If the earnings trend continues, it will mark the fifth straight quarter of double-digit earnings growth for the index. For companies with the majority of sales inside the U.S., the earnings growth rate is 16.6%. For companies with less than 50% of sales inside the U.S., the earnings growth rate is 8.4%.
- Revenue Growth: The blended revenue growth rate for the S&P 500 for Q4 2018 is 7.0%. For companies with the majority of sales inside the U.S., the revenue growth rate is 7.2%. For companies with less than 50% of sales inside the U.S., the revenue growth rate is 6.7%.
- Earnings Revisions: At the end of December, the estimated earnings growth rate for Q4 2018 was 12.1%. Six sectors now have higher growth rates due to upward revisions to EPS estimates and positive EPS surprises.
- Earnings Guidance: 53 S&P 500 companies have issued negative EPS guidance for Q1 2019, compared to 12 S&P 500 companies with positive EPS guidance. Negative EPS guidance is at 82%, above the 5-year average of 71%.
- Valuation: The S&P 500 forward 12-month P/E ratio is 15.8, below the 5-year average (16.4) but above the 10-year average (14.6). (See Figure 2.)
- Full-Year 2019 Outlook: Analysts predict a Q1 2019 decline in earnings and low single-digit growth in earnings for the second and third quarters of 2019. Fourth-quarter 2019 earnings are projected to be the strongest of the year on a year-over-year basis, up 9.0%. The estimated earnings growth rate for the S&P 500 for calendar year (CY) 2019 is 5.0%. The estimated revenue growth rate for the S&P 500 for CY 2019 is 5.1%.
FIGURE 2: S&P 500 CHANGE IN FORWARD 12-MONTH EPS VS. CHANGE IN PRICE
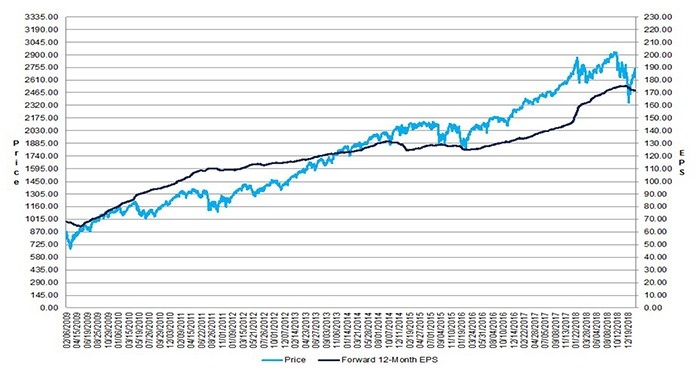
Source: FactSet
The Energy sector is expected to show the highest earnings growth for Q4 2018 among S&P 500 groups. The Communications Services, Industrials, and Consumer Discretionary sectors are the only other sectors expected to surpass the average for all S&P 500 companies.
FIGURE 3: S&P 500 EARNINGS GROWTH BY SECTOR (Q4 2018)
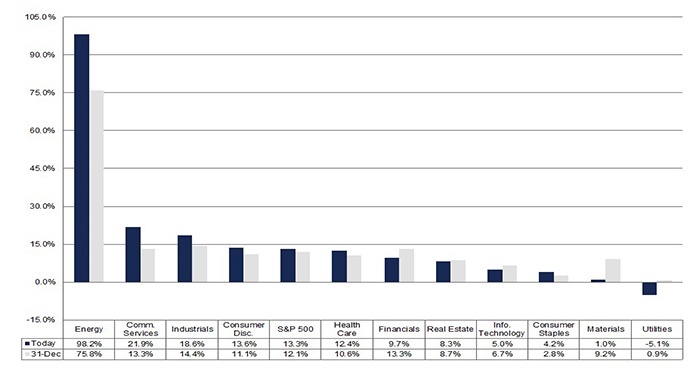
Source: FactSet
Related to the forward guidance for earnings, Bespoke Investment Group says, “While Q4 beat rates have been an upside surprise in our view, companies are really throwing in the towel on forward expectations. Our guidance spread measures the percentage of companies raising guidance minus the percentage of companies lowering guidance, and this season it currently stands at –6.6 … one of the weakest readings we’ve seen over the last 15+ years.”
FIGURE 4: SPREAD BETWEEN % OF COMPANIES RAISING AND LOWERING GUIDANCE
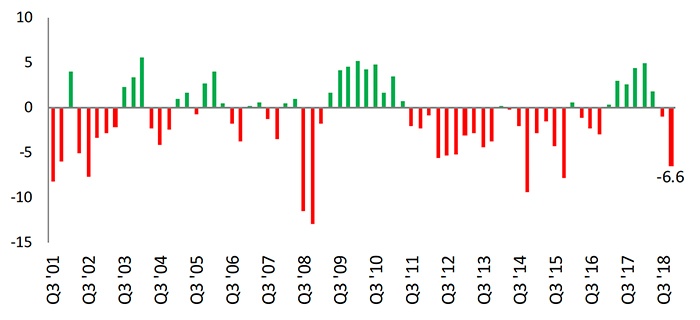
Source: Bespoke Investment Group
However, Bespoke also notes that this has not always been a negative for the stock market, setting up an environment where companies can beat lowered expectations more easily in future quarters “should all the big concerns not materialize.”
Bespoke adds,
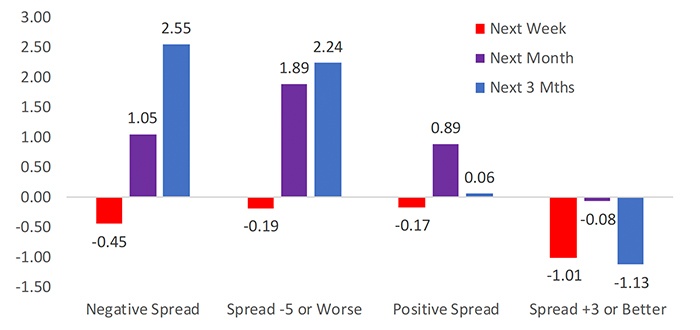
“The S&P averages declines in the week after earnings season ends under all scenarios, but performance is much stronger over the next month and three months when the guidance spread is negative compared to when it’s positive.
“When our guidance spread has ended earnings season at a level of -5 or lower, the S&P has averaged a gain of 2.24% over the next three months. When our guidance spread has ended earnings season at a level of +3 or higher, the S&P has averaged a decline of 1.13% over the next three months.”
FIGURE 5: S&P 500 AVG. % CHANGE AFTER EARNINGS SEASON BASED ON GUIDANCE SPREAD
Source: Bespoke Investment Group