According to FactSet, with 55% of S&P 500 companies reporting Q4 2016 earnings as of Feb. 3, fewer companies are reporting earnings and sales revenue above the five-year historical average.
However, this earnings season is far from a bust. The projected year-over-year earnings growth rate for Q4 2016 is now at 4.6%, a significant improvement over December estimates of 3.1%. It also represents the second consecutive quarter of earnings growth, helping confirm a break in the trend for earnings declines.
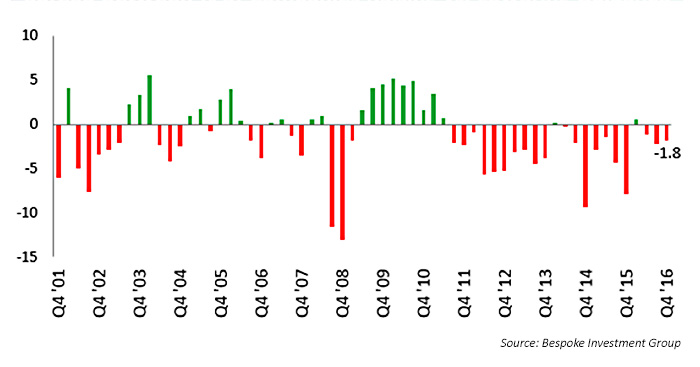
Seven sectors are reporting year-over-year earnings growth, led by the utilities and financials sectors (Figure 1). The financial sector also experienced a significant boost in share prices overall last week, with equity prices for major financial companies moving higher on the back of a positive employment report and the heightened expectations that the Trump administration will ease financial regulations.
The financial sector as a whole moved last week from being slightly in the red for the year to a gain in 2017 of about 2%. On Friday (Feb. 3) alone, the shares of Goldman Sachs rose 4.6%, Morgan Stanley was higher by 5.5%, and Wells Fargo was up 2.7%. The Wall Street Journal notes that the index tracking large banks has gained 24% since the U.S. election in November.
Factset offered the following specific insights on the Q4 2016 earnings season in its weekly update on key metrics:
- Overall earnings performance: 65% of S&P 500 companies surpassed the mean EPS earnings estimate, and 52% of S&P 500 companies delivered sales results above the mean analyst estimate.
- Earnings growth: The blended earnings growth rate for the S&P 500 is 4.6%. Two consecutive positive growth quarters have not been seen since Q4 2014 and Q1 2015.
- Earnings revisions: Nine of the 11 sectors have higher growth rates today (compared to Dec. 31) due to upside earnings surprises and upward revisions to earnings estimates, led by the financial sector.
- Earnings guidance: For Q1 2017, 44 S&P 500 companies have issued negative EPS guidance and 21 S&P 500 companies have issued positive EPS guidance. However, the overall 1.5% decline in forward guidance is below the historical five-year average of a 2.3% decline in forward guidance at this point in the earnings cycle.
- Valuation: The forward 12-month P/E ratio for the S&P 500 is 17.1, based on a forward 12-month EPS estimate of $133.54.
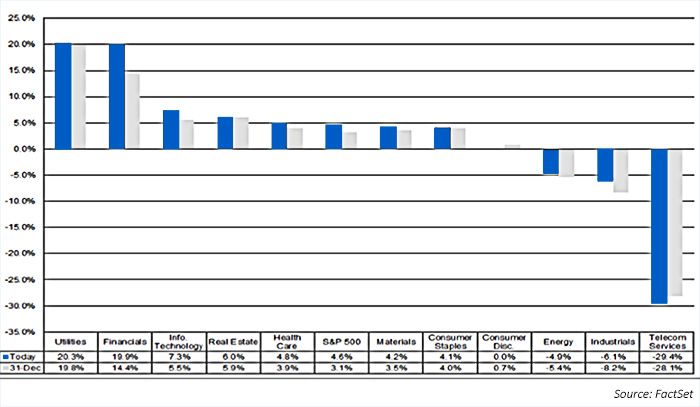
On the topic of earnings estimates for Q1 2017, Bespoke Investment Group noted early this week that the spread between companies reporting positive guidance and those reporting negative guidance has just recently moved into the red. However, they also state that at this point in the earnings cycle, that is more frequently the case than not and that the trend is not out of line with results in recent years (Figure 2).
Bespoke said specifically, “We thought companies might finally turn a corner in terms of forecasting and sentiment, similar to what we’ve seen in the various consumer sentiment readings since the election last November. There’s still time for the spread to flip back positive before earnings season officially ends in a couple of weeks, but we’re not holding our breath for it.”