

Q3 earnings season is now more than half over, with over 70% of S&P 500 companies reporting as of last Friday (Nov. 1).
As is usually the case, some companies have posted surprise results to the upside, and many companies have disappointed.
Recently, there has been an interesting development in the relatively favorable treatment of both outperforming and underperforming companies.
Axios reports in its article “Investors more bullish on good earnings and less bearish on bad,”
“U.S. stock market investors are showing their bullish bias this earnings season, buying big on companies that beat expectations and going easy on selling companies that miss.
“‘Shares of companies that topped forecasts rose an average of 2% in the two days after reporting results, beating the five-year average of 1%, according to data compiled by FactSet. Those that fell short have averaged a 2.1% pullback, below the half-decade average of 2.6%,’ WSJ’s Michael Wursthorn reports.
“‘So far, the winners are outpacing the losers. … 66% have risen in subsequent trading sessions, a five-year high.’”
The enthusiasm, says Axios, has come despite FactSet data showing overall S&P 500 earnings are on pace to decline by almost 3% in Q3, falling for the third quarter in a row.
FactSet provided this earnings and revenue update as of the end of last week:
• “In terms of earnings, the percentage of companies reporting actual EPS above estimates (76%) is above the 5-year average.
• “In terms of sales, the percentage of companies (61%) reporting actual sales above estimates is above the 5-year average.
• “The blended (combines actual results for companies that have reported and estimated results for companies that have yet to report) earnings decline for the third quarter is -2.7%, which is smaller than the earnings decline of -3.8% last week.
• “If -2.7% is the actual decline for the quarter, it will mark the first time the index has reported three straight quarters of year-over-year declines in earnings since Q4 2015 through Q2 2016. It will also mark the largest year-over-year decline in earnings reported by the index since Q2 2016 (-3.2%).
• “The blended revenue growth rate for the third quarter is 3.1%, which is above the revenue growth rate of 2.8% last week. Positive revenue surprises reported by companies in multiple sectors were responsible for the increase in the overall revenue growth rate during the week. If 3.1% is the actual growth rate for the quarter, it will mark the lowest revenue growth rate for the index since Q3 2016 (2.7%).”
Source: FactSet
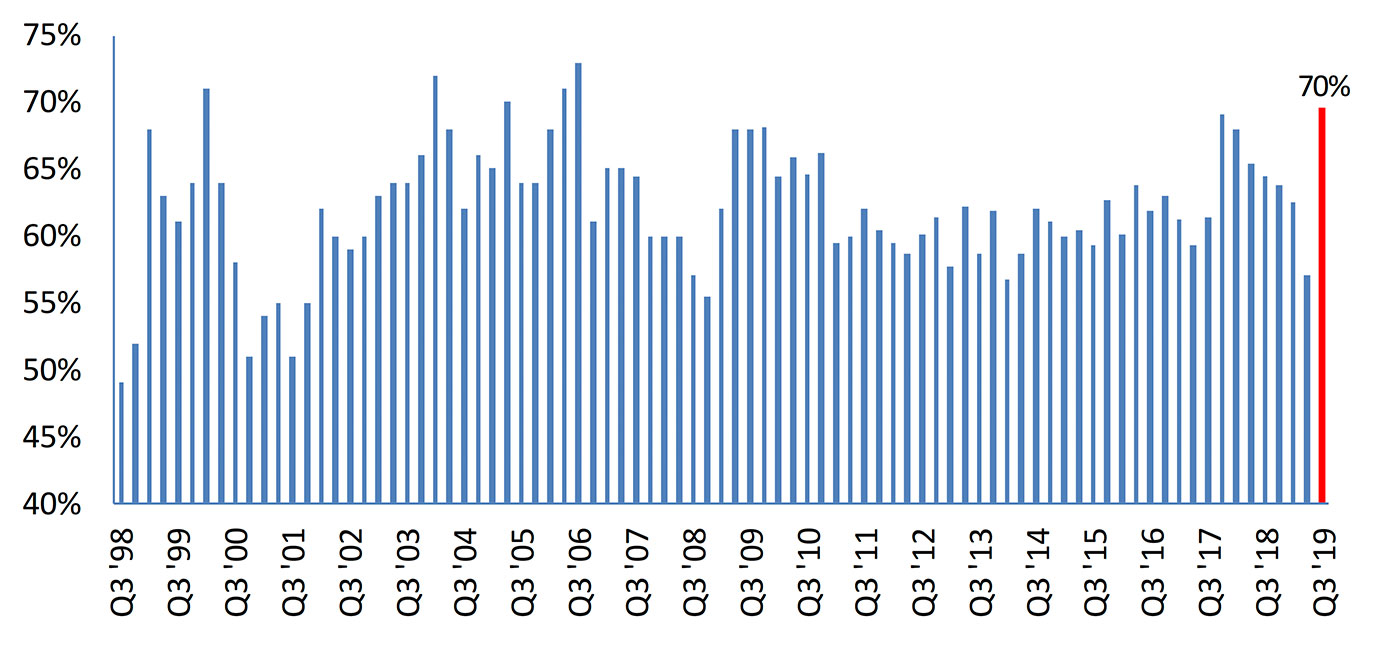
Bespoke Investment Group took a look last Friday at the earnings results for the S&P 1500, with over 1,100 companies reporting, and found that 70% of companies were exceeding bottom-line earnings-per-share expectations (Figure 2).
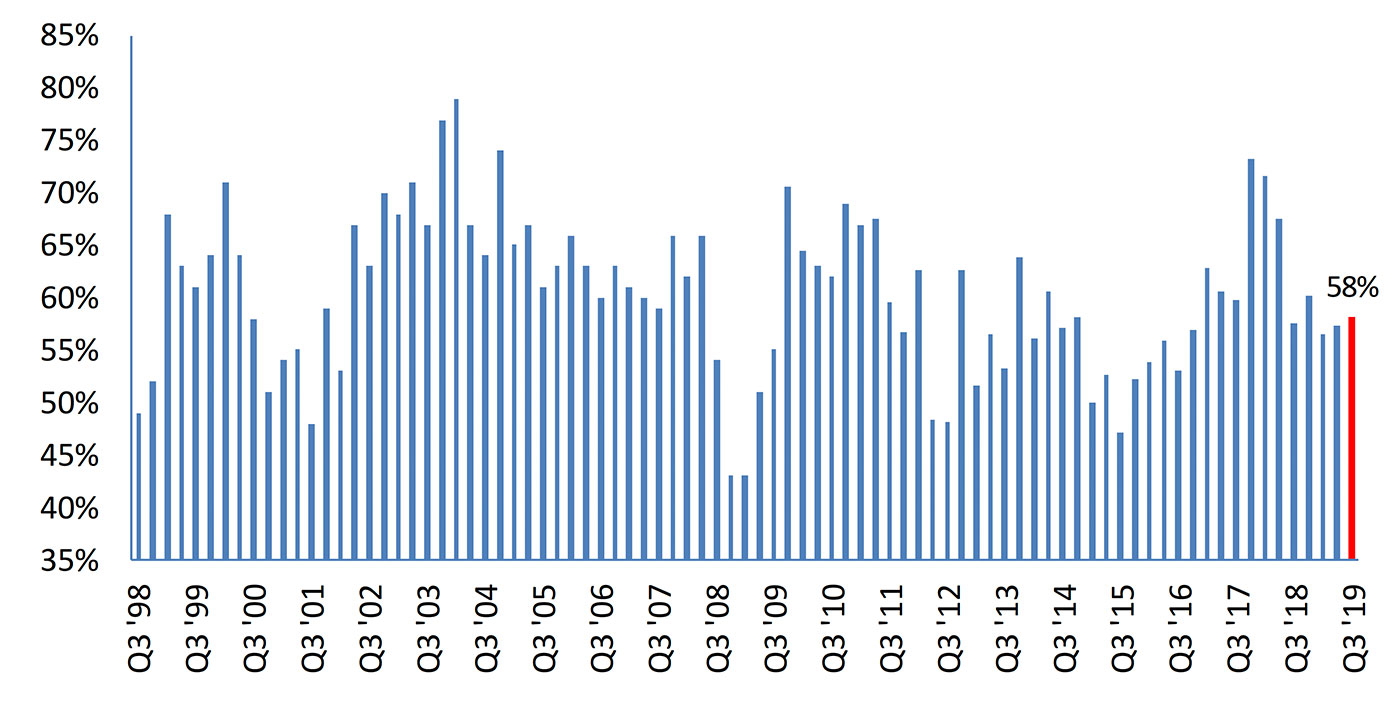
This was a strong result, but revenue “beats” were far lower, coming in at 58% (Figure 3).
Source: Bespoke Investment Group
Source: Bespoke Investment Group
As far as the outlook for Q4 2019 now stands, FactSet says the S&P 500 is now projected to report a slight year-over-year decline in earnings. If this happens, it will “mark the first time the index will have reported four consecutive quarters of year-over-year earnings declines since Q3 2015 through Q2 2016.”
However, FactSet reports, “analysts currently expect earnings growth to return in the first quarter of 2020 (5.6%).”