

Earnings season for the second quarter kicked off this week with the most noteworthy reports coming from four of the largest “traditional” U.S. banks and two of the most influential investment firms: Citigroup (C), Wells Fargo (WFC), JPMorgan Chase (JPM), Bank of America (BAC), Goldman Sachs (GS), and Morgan Stanley (MS).
Barron’s wrote last weekend, before the release of any of the companies’ earnings reports,
“After being hammered in the fourth quarter of last year, bank shares have recovered significantly in 2019. The first bank to report, Citigroup is up 38% this year, compared with about 20% for the broader S&P 500 index. Bank of America shares have risen 20%, while Goldman Sachs stock is up 28%. JPMorgan Chase shares have gained 18% and Morgan Stanley is up 13%. Wells Fargo, still laboring under a Federal Reserve-imposed balance-sheet cap and without a permanent chief executive, is up just 3%.
“Despite their climb back from their late-2018 thrashing, it’s hard to see the current environment as a positive one. A dovish turn by the Fed, the continuing U.S.-China trade war, worries of an economic slowdown, likely lower investment-banking revenue, and a seemingly secular fall in trading profits are likely to keep a lid on big bank shares.”
According to MarketWatch, actual bank earnings reports so far this week have “painted a mixed picture of the banking industry, and the broader economy’s strength.” Banks reporting earnings were generally “able to surpass much lowered expectations for second-quarter performance,” but, according to Stephen Biggar at Argus Research, “the broad theme we’re seeing is slowing loan growth, somewhat muted trading revenues, and shrinking margins.”
Another Barron’s columnist added,
“Fifty-six S&P 500 companies are expected to report this coming week, followed by 122 the following week and 121 the week after that. After companies posted year-over-year earnings-per-share growth of 0.8% in the first quarter, the consensus estimate is for a 2.7% drop this quarter.
“But S&P 500 companies’ tend to beat earnings estimates: The actual earnings growth rate has been 3.7 percentage points higher than forecasts, on average, over the past five years. … That means the reported earnings-growth rate in the second quarter will again likely be close to 1%—nowhere near early 2018’s 20%-plus growth, but not in decline either.
“Peeling back those likely-to-be uninspiring headline numbers could paint a rosier picture. Credit Suisse Chief U.S. Equity Strategist Jonathan Golub notes that the median S&P 500 company is expected to grow EPS four percentage points faster than the index. … Forward guidance and management commentary may help investors decide whether the first half of 2019’s stagnant earnings are just a lull—or if they merely precede another leg down in the second half.”
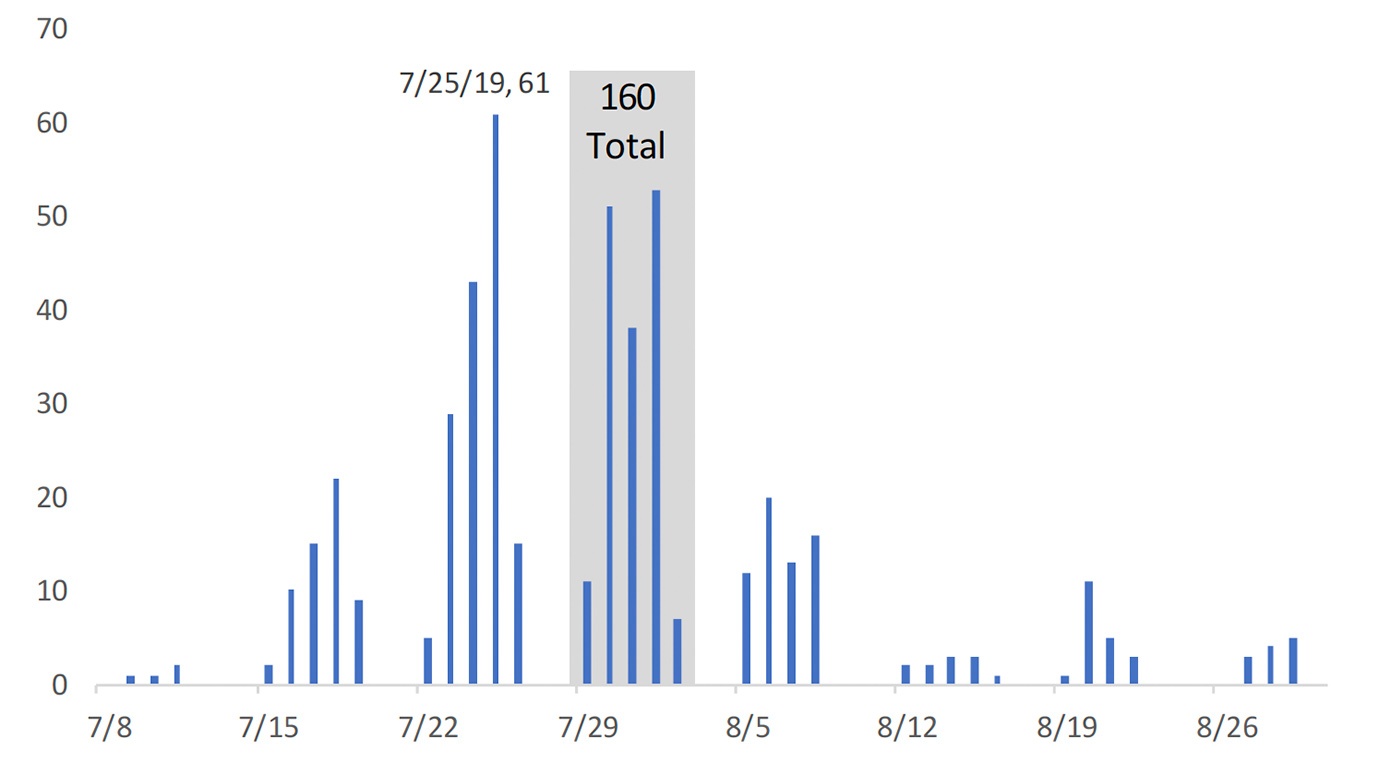
Source: Bespoke Investment Group
Financial data and software company FactSet provided the following broad overview of the upcoming earnings season on July 12,
- “Earnings Growth: For Q2 2019, the estimated earnings decline for the S&P 500 is -3.0%. If -3.0% is the actual decline for the quarter, it will mark the first time the index has reported two straight quarters of year-over-year declines in earnings since Q1 2016 and Q2 2016.
- “Earnings Revisions: On March 31, the estimated earnings decline for Q2 2019 was -0.5%. Ten sectors have lower growth rates today (compared to March 31) due to downward revisions to EPS estimates.
- “Earnings Guidance: For Q2 2019, 88 S&P 500 companies have issued negative EPS guidance and 26 S&P 500 companies have issued positive EPS guidance. If 88 is the final number for the quarter, it will mark the second highest number of S&P 500 companies issuing negative EPS guidance for a quarter since 2006.
- “Valuation: The forward 12-month P/E ratio for the S&P 500 is 17.1. This P/E ratio is above the 5-year average (16.5) and above the 10-year average (14.8).
- “Earnings Scorecard: For Q2 2019 (with 24 of the companies in the S&P 500 reporting actual results for the quarter), 20 companies have reported a positive EPS surprise and 17 companies have reported a positive revenue surprise.”
FIGURE 2: S&P 500 FORWARD 12-MONTH EPS VS. CHANGE IN PRICE (10 YRS.)
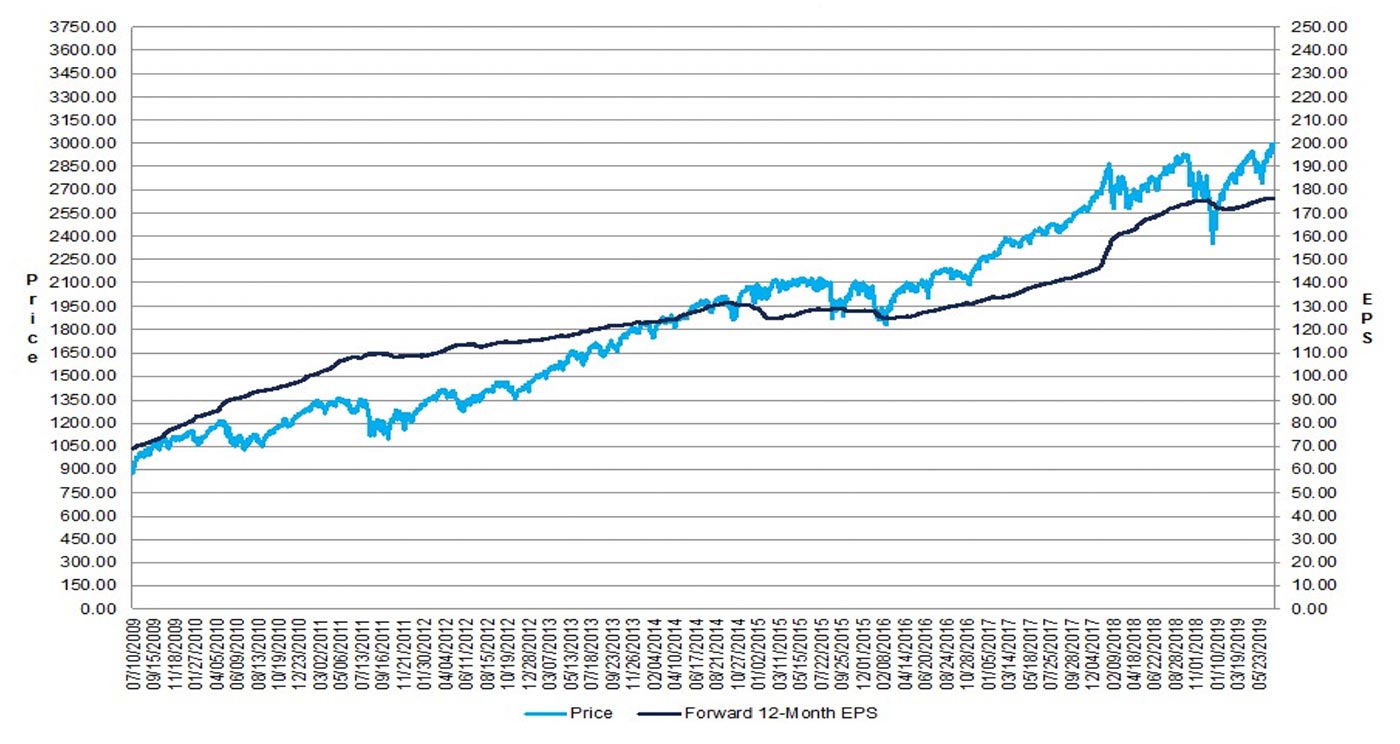
Source: FactSet
The Health Care sector is currently projected as the leading sector for Q2 earnings growth with a gain of 2.1%, according to FactSet, with the Information Technology and Materials sectors projected to see double-digit declines.
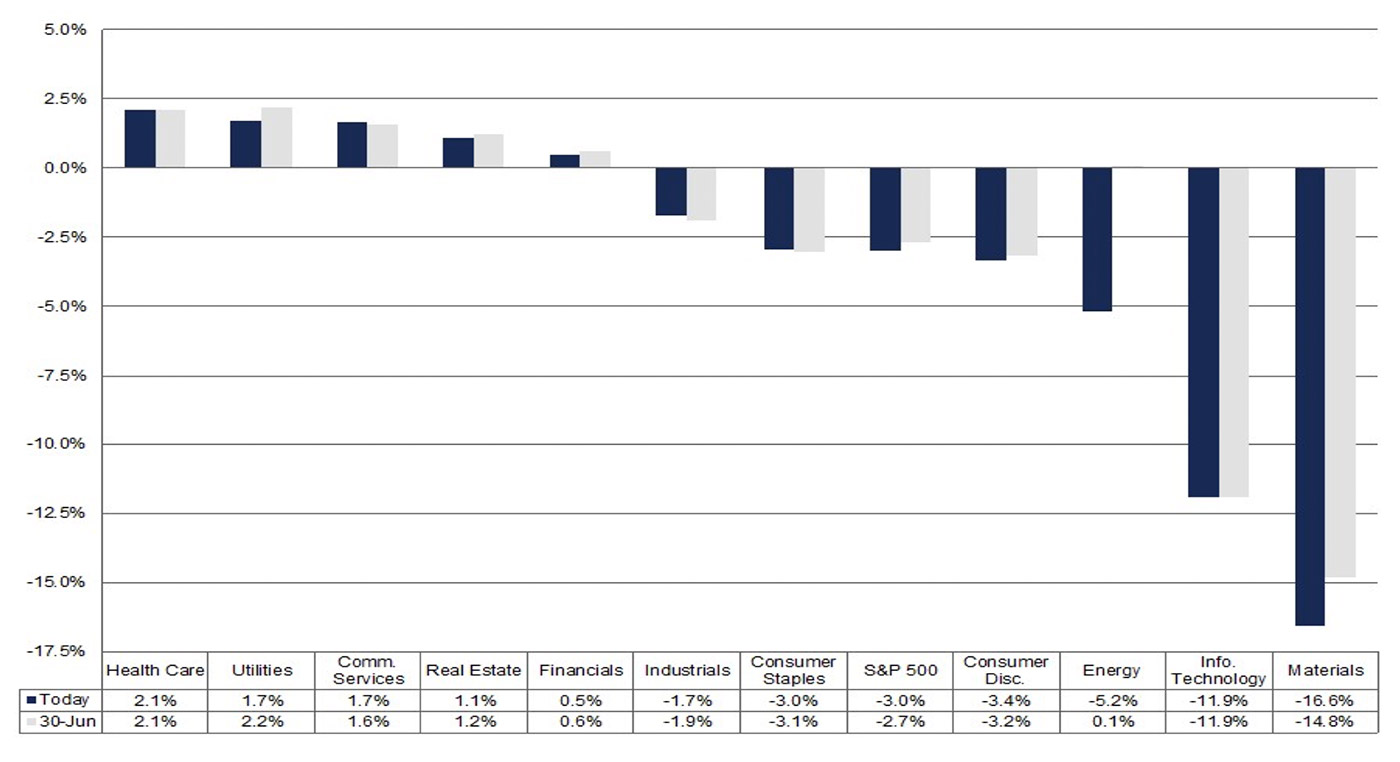
Source: FactSet
Bespoke Investment Group noted last week that the fact that earnings growth is projected to be weak for Q2 2019 is not necessarily a negative for the overall equities market:
“The key trend to watch this earnings season will be how often the term ‘China’ or ‘tariffs’ comes up in quarterly conference calls. With increased uncertainty created by the on-again, off-again escalation of trade disputes between the US and its largest trading partners, we have seen a significant uptick in negative analyst commentary. Over the last four weeks, analysts have cut forecasts on a net of 333 companies in the S&P 1500, or more than 22% of the stocks in the index. … Analyst sentiment is understandably negative heading into earnings season, which should set the bar low for companies to exceed. …
“In order to see how the dynamic between analyst revisions and the performance of the equity market plays out during earnings season, as we do heading into each quarter, we compared the net EPS revisions spread for the S&P 1500 (four week spread between companies with positive analyst EPS revisions and negative EPS revisions) at the start of earnings season to the performance of the S&P 500 over the ensuing six weeks—a period that roughly encapsulates the entire earnings season.
“When the analyst expectations bar is set low for earnings season (negative spread), the S&P 500 typically sees a positive performance during earnings season. Conversely, when the bar is set high heading into earnings season (positive spread), the market has tended to struggle during the reporting period.”
“Since the start of 2009, there have been seven prior periods where the revisions spread was more negative than it is now, and in those periods the S&P 500 averaged a gain of 4% during earnings season with gains in all but one period. The only down period was Q4 2015 when the S&P 500 fell just 0.22%. Earnings aren’t the only driver of stock prices in the short-term, but from a sentiment standpoint, even with the S&P 500 right near record highs, expectations remain very low heading into this earnings season.”
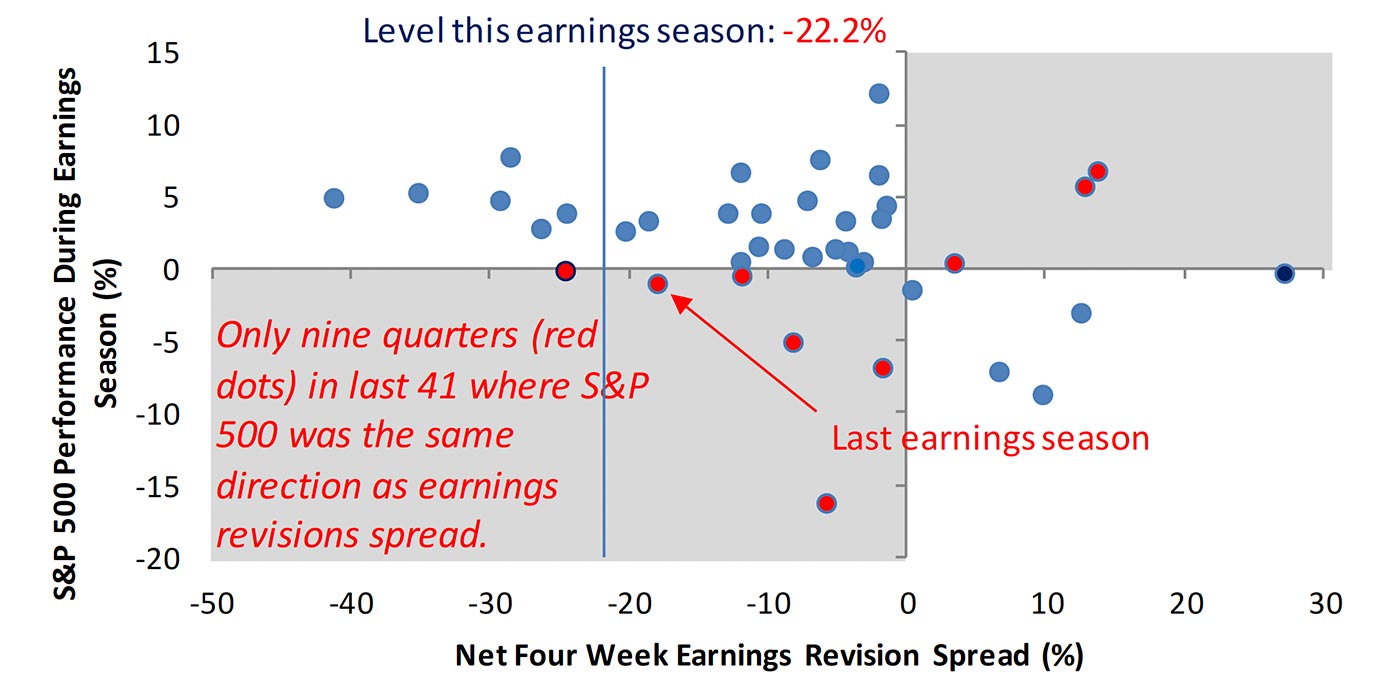
Source: Bespoke Investment Group