

P/E ratios are above average and markets are overvalued—be cautious!
P/E ratios are low—it’s a great time to buy!
Comments like these are heard quite often during different stages in the market. Should one pay attention to those warnings, or is there a better perspective?
Price-to-earnings (P/E) ratios on the market reflect both investor optimism and pessimism. At market peaks, P/Es will often be at or near record highs. And during the depths of pessimism at bear market lows, P/Es shrink. As a timing indicator, looking at P/E levels in relationship to being above or below average is, in my opinion, worthless.
As an example, the average P/E for the S&P 500 based upon trailing 12-month earnings was 20.0 for the past 34 years (1981-2015). That period encompasses a full secular bull and secular bear and includes the start of a new secular bull. What if you used P/E as a timing tool?
I looked at buying and holding stocks only when the ratio was a “good” value (below 20.0) and being out of stocks when they were “expensive” (above 20.0) for the time period of August 1982 through September 2015.
- A strategy using P/E ratios as a timing tool would have gained 1,236%
- A pure buy-and-hold strategy would have gained 1,775%
On the positive side, investors would have completely avoided the 2000-02 and 2007-09 bear market 50% losses. However, overall returns were 30% lower because of missing out on big rallies of 90%, 56%, and 65%. The bottom line is that P/E ratios are a poor timing indicator.
If you look at the trend in P/E ratios during secular bull or bear markets, it does offer a useful tool for analyzing where the market might be versus the extremes of the ultimate market move (which usually takes years).
During the last two secular bear markets, the P/E ratio fell by 60% from peak to trough. Knowing that provides a valuable insight and allows an advisor or investor to put the decline in historical perspective (“we are getting near a major bottom”).
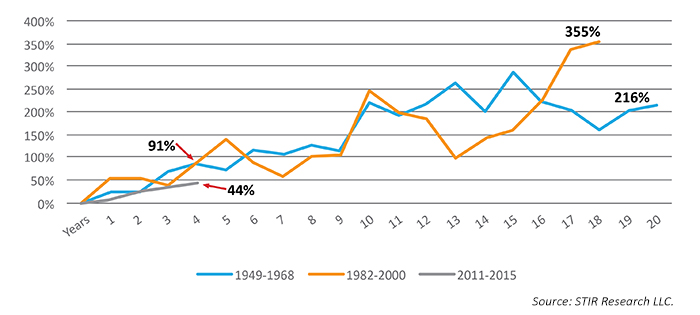
During the last two secular bull markets, as optimism rose, so did P/E ratios, by 216% from 1949 to 1968 and 355% in the period of 1982-2000. Knowing that P/Es can’t expand forever, big gains in P/Es should temper optimism, but only at extremes.
The following chart looks at the current P/E ratio in relation to the growth or expansion of the P/E ratio in previous secular markets.
Pessimism was at its worst in 2011, with P/E ratios falling by 60% from a peak of 34 in 2000 to a low of 13.5 in 2011 (its lowest level since 1985). Counting from October 2011, the market is only in year four of a new secular bull market. In previous secular bull markets, by this time, P/E ratios had expanded by 91% from their lows as investor optimism returned.
In this secular bull, with so many still doubting that one is even occurring, the P/E ratio has only grown by 44%. That is half of the growth we would normally expect by year four, and far from the 200%-plus gain of a typical secular bull market. The market is far from being overvalued from a historical perspective when looking at it from a secular viewpoint.
GROWTH IN P/E RATIOS IN SECULAR BULL MARKETS
 Marshall Schield is the chief strategist for STIR Research LLC, a publisher of active allocation indexes and asset class/sector research for financial advisors and institutional investors. Mr. Schield has been an active strategist for four decades and his accomplishments have achieved national recognition from a variety of sources, including Barron's and Lipper Analytical Services. stirresearch.com