


The daily chart of the U.S. Dollar Index has recently displayed a clearly defined trading range, bound on the lower end by 93.87 and on the upper end by 96.87. Should 93.87 fail, the Index will likely trade to 92.83. On the other hand, moving above 96.87 would likely spell higher levels in the future.
FIGURE 1: RECENT U.S DOLLAR TRADING RANGE
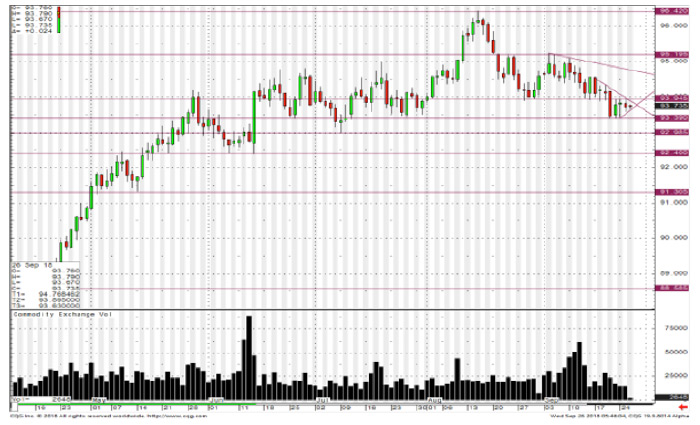
Source: CQG market data, as of 9.26.18
FIGURE 2: SWINGS IN U.S. DOLLAR INDEX (DX) SINCE MAY 2014 BOTTOM
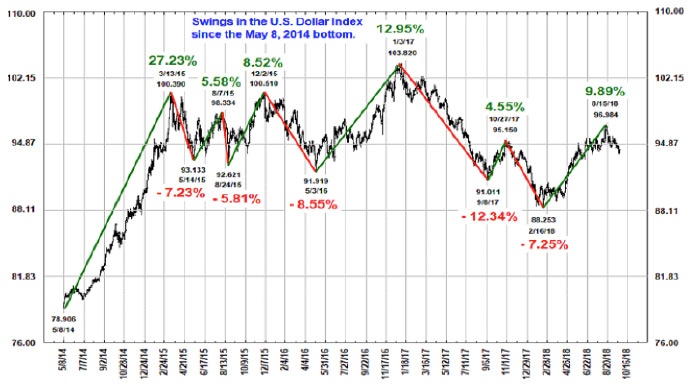
Source: The Chart Store
Now that we have squared away the U.S. dollar’s technical position, we should probably address why we care so much about it. U.S. exports are valued in U.S. dollars; that includes everything from Ford automobiles to Crayola crayons. A more expensive dollar means a more expensive crayon for foreign purchasers. Staedtler colored pencils (made in Germany) start to look more appealing abroad … get my drift? As the dollar continues to appreciate, U.S. manufacturers can get priced out of foreign markets, hurting the bottom line and, ultimately, the stock price. When substitute goods become materially cheaper because of currency fluctuations, U.S. manufacturers start to have a problem.
While the relationship between the dollar and U.S.-manufactured goods is well-documented, less so is the dollar’s relationship to volatility. As the U.S. Dollar Index makes new highs, the VIX has a tendency for explosive episodes to the upside. This occurred most notably over the past 10 years in October 2008, August 2015, and late 2017/early 2018.
Within this lies a two-pronged trade. Options can be sold against owned stock when the VIX explodes and option premiums correspondingly become more attractive to sell. Secondly, the U.S. Dollar Index can be sold or puts can be purchased with the knowledge that these spikes tend to be short-lived. Recently, however, the VIX is trading toward the lower end of its range. This provides an opportunity to buy cheap insurance on your portfolio via put options on the S&P 500.
FIGURE 3: VIX INDEX MONTHLY BARS (2011–2018)
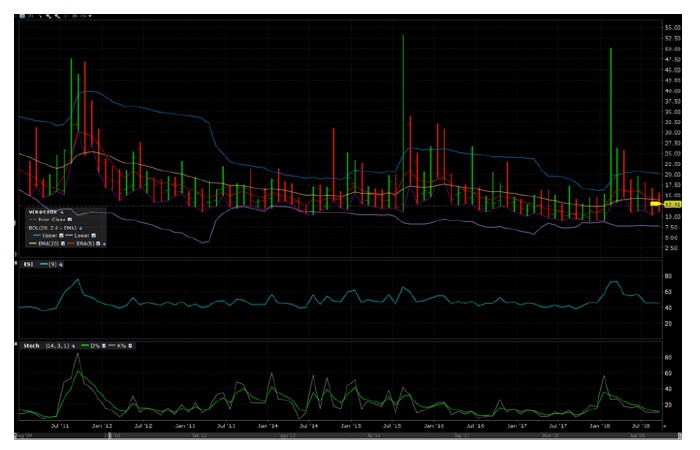
Source: CQG market data
The complacency indicated by today’s VIX tells us nothing of how long that complacency will last. As a former options market-maker on the trading floor, I used to occasionally purchase “wing puts” on the S&P 500 or Russell 2000 when volatility was low. These were relatively inexpensive put options that were way out of the money with a low probability of success. The floor community often referred to these options as lottery tickets, and understandably so. Markets are not bell-shaped but have fat tails. Every so often, the VIX would blow up and our lottery tickets would become very profitable. Sure, we lost money more often then we made money with this strategy, but the profits from winners more than offset the losses from losers.
As expected, the Federal Open Market Committee (FOMC) hiked interest rates at their September 2018 meeting (there was a 90%-plus probability of a hike). How will this impact the U.S. dollar? Higher rates attract investors seeking higher yields, increasing demand for dollars to purchase dollar-denominated bonds, in turn driving up the value of the dollar. Imports in the U.S. become cheaper, inflation tends to remain in check, gold becomes a poorer investment choice (unless inflation starts to increase), and interest rates go up for mortgages and other lending instruments. Cheap imports may steal business from American companies, which tends to curtail hiring and wage increases as production decreases.
FIGURE 4: RELATIONSHIP OF THE U.S. DOLLAR TO THE PRICE OF GOLD
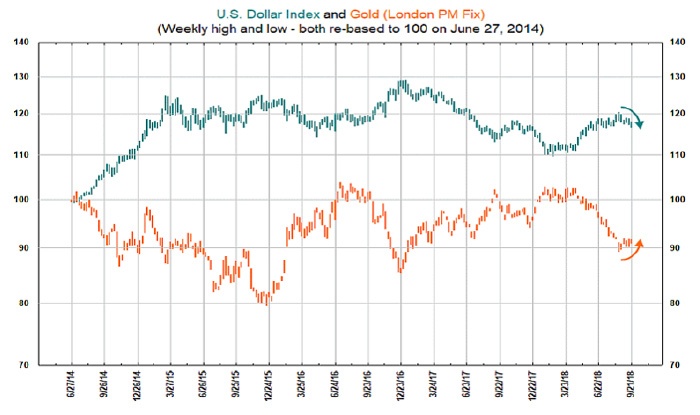
Source: The Chart Store
Highly-levered, yet healthy, companies can survive increases in debt service costs due to rising interest rates. Companies with shakier balance sheets, or companies bought at highly inflated valuations, may stumble and fail. We have seen a massive increase of the latter in the current environment, and it is something to take note of.
As to the housing market, rate increases should cause an initial spike in prices as buyers rush to obtain mortgages and make purchases before rates increase further. This, however, is quickly curtailed as the increased borrowing costs raise the cost of mortgages, reducing consumers’ purchasing power. This translates into many purchasers being forced to buy a less expensive house. The same amount of money goes out the door, but the allocation changes between interest and principal payment.
FIGURE 5: AVERAGE RATE OF 30-YEAR FIXED-RATE MORTGAGE
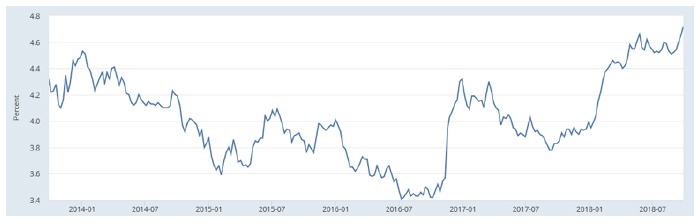
Source: Federal Reserve Bank of St. Louis
The key takeaway from this discussion is that the U.S. dollar, interest-rate moves by the FOMC, market volatility, prices of various asset classes, and the health of U.S. businesses are all interrelated in many ways. While correlations are not always perfect, traders and investors would be wise to keep an eye on the U.S. dollar as an early indicator of potential spikes in equity market volatility—and for impacts on various aspects of the U.S. economy.
The opinions expressed in this article are those of the author and do not necessarily represent the views of Proactive Advisor Magazine. These opinions are presented for educational purposes only.
 Jeanette Schwarz Young, CFP, CMT, CFTe, is the author of the Option Queen Letter, a weekly newsletter issued and published every Sunday, and "The Options Doctor," published by John Wiley & Son in 2007. She was the first director of the CMT program for the CMT Association (formerly Market Technicians Association) and is currently a board member and the vice president of the Americas for the International Federation of Technical Analysts (IFTA). www.optnqueen.com
Recent Posts: