

My suggested allocations of 6% each into the equity sector ETFs XLK, XLP, XLU, XLV, and XLY, paired with suggested allocations of 35% each into the bond ETFs IEF and SHY, has delivered a 2.72% return through August 11. Meanwhile, SPY (S&P 500 ETF) has returned 4.64% —it hasn’t been sick this year for sure.
While it may seem like my suggestions were a failure, let’s review further. The suggested allocation has returned about 60% of the S&P 500’s returns, but with a daily standard deviation of 0.18% compared to the S&P 500’s 0.82%. This results in an average daily weighted drawdown of -0.20% compared to the S&P 500’s -0.77%, and a maximum drawdown of -0.58% compared to the S&P 500’s -5.52%. In other words, my suggested allocations had about 80% less volatility, 75% less daily strain, and 90% less maximum drawdown. And this with 70% allocated to bonds, with 35% in the sleepy SHY. During the two-day Brexit shock (that story is not over, by the way), the S&P fell -5.52%, while the “summertime blues” allocation fell -0.08%.
My suggestions are not looking so bad now. And we still have half a month left for the markets to bake in further results.
Here is a roadmap for consideration based on seasonal market trends and analytics within a small ETF universe for September through November.
As you probably know, September is traditionally a pretty “smelly” month for equities, with relief usually arriving by mid-October. The October “V-shape” rebound is significant compared to other months in its “angle.” November is considered a relative walk in the park—which is only enhanced by the monthlong excitement of turkey, dressing, beer, and football.
If you want to remain moderately conservative, much like the allocation I gave for June–August, then take a look at a 7.5% allocation in four sectors: industrials (XLI), technology (XLK), staples (XLP), and discretionary (XLY). Pair that 30% sector exposure to a 15% allocation to IEI (3–7 year government bond), 20% allocation to IEF (7–10 year government bond), and 35% allocation to TLT (20–30 year government bond). This combination has been profitable in September–November periods 79% of the time since 2002.
The worst complete three-month period is -3.41%, the best is 5.58%, and the average return is 2.36%. If you want to be more aggressive or are skittish about the current bond market—think about 12.5% each to XLI, XLK, XLP, and XLY, and pair it with 10% to IEI, 15% to IEF, and 25% to TLT. This combination has been profitable 93% of the time since 2002. The only time it was not was the complete three-month period in 2008, when it was down -11.55% (still much less smelly than the S&P at that point). During its best period, it returned 6.79%. Its average return is 2.82%.
The point to finding boring but consistent roadmaps for asset allocation in seasonally thematic market periods is to deliver consistency to the end user—your clients—which keeps them loyal.
Let’s face it, in the past 16 years there have been two major bull runs, two major retreats of 50% or more, a housing bubble, a banking crisis, debt-ceiling panic, manipulations via QE, “Operation Twist,” suppressed interest rates, the eurozone crisis, and so on. And these examples are the ones that bubble up to mainstream coverage that clients see. Ultimately, clients want to reach a financial destination and stay confident in the vehicle to reach that destination. Being aware of seasonal trends in the market can provide a roadmap—the road should be smoothly paved, straight as possible, and have a few rest stops and timely repairs.
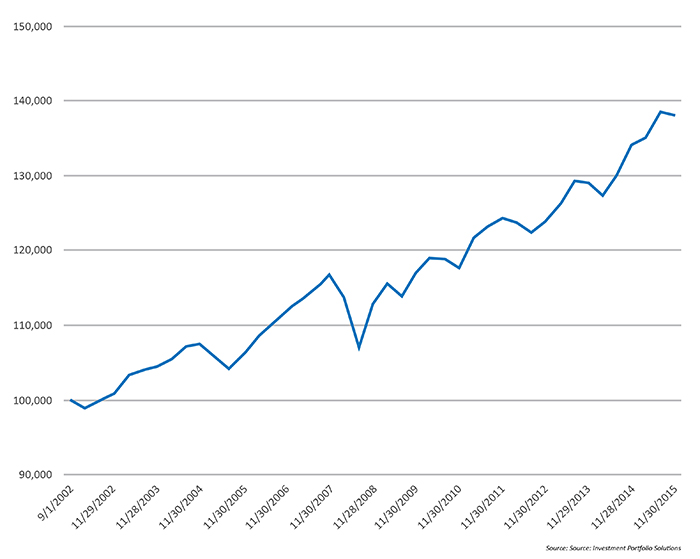
$100,000 INVESTED IN 3-MONTH “SEPTEMBER–NOVEMBER ONLY” STRATEGY (2002–15)
 Ian Naismith is a partner and the index designer of Smooth Sailing Indexes Inc., which is a leader in tactical “risk-on/risk-off” index development. Mr. Naismith has been analyzing and trading the markets since the early 1990s. He is a member of the National Association of Active Investment Managers (NAAIM) and has also served as board member and president. www.smoothsailingindexes.com